

Markets: US Major Stock indices closed at New All Time Highs to celebrate the 4th of July last week.
S&P 500 cash (SPX) made new all time highs at 6279.36. NASDAQ 100 cash closed at new all time highs at 22866.97 last week. Bond yields rose slightly, dollar stabilised and Gold rose this past week.


Week in review
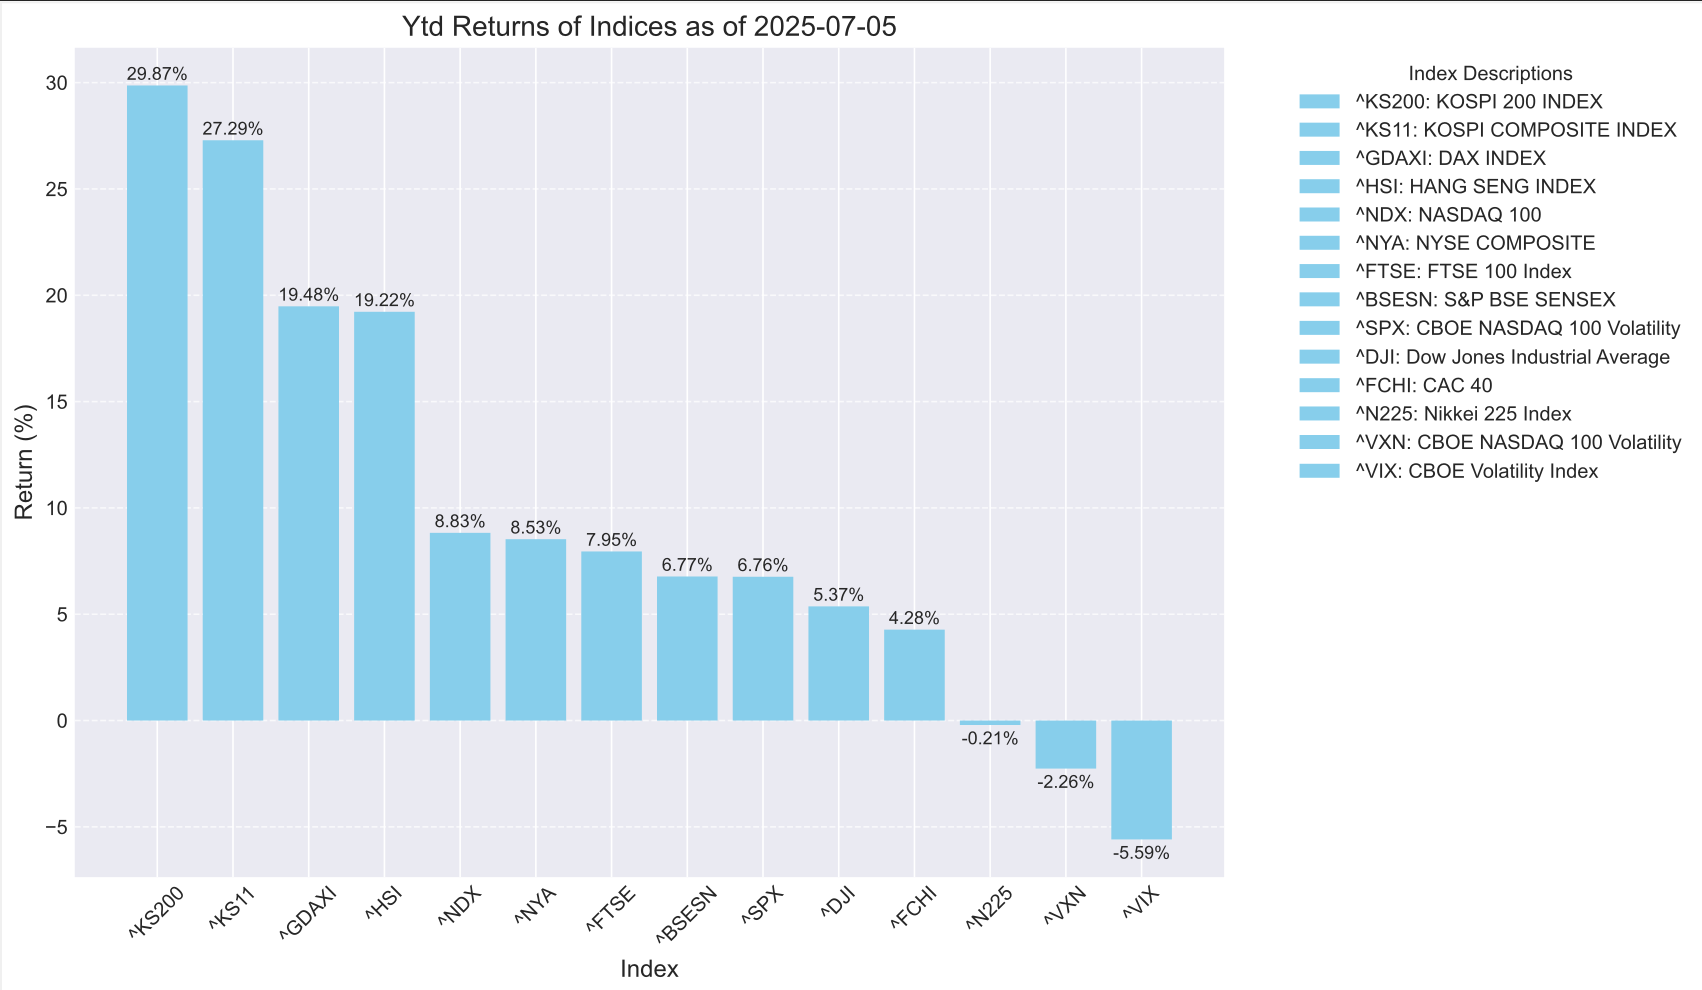
Here is an overview of the World stock indices that we follow here at Market Chart Pattern. The US equity markets performed well, whereas, the European counterparts lagged behind in performance. Hang Seng followed by German DAX were the worst performers.
Here is how the equity markets performed last week. Interestingly, the VXN which measures the volatility for the NASDAQ 100 was up. Did someone buy some protection?

Below are the Year to Date returns. We can see that the South Korean stocks have performed really well followed by German stocks and now the US stocks are also in the positive territory and rising.
Sector performance in the US markets
This past week’s rising star sector/etf has been KRE which is the Regional banking ETF. It appears the tax cuts proposed in the ‘Big Beautiful Bill’ are likely to be helpful for smaller companies. The ‘Retail’ ETF which belongs to the Consumer Cyclical sector also performed really well and closed the week 4.24%. Home Builders were up 4.20% which is also part of the Consumer Cyclical sector. Defence and Aerospace in the Industrials sector was the worst performer and was down -0.42%.
It appears, Financials, Industrials and perhaps Consumer Cyclical sectors are likely to benefit moving forward.

Here are the sector/etf returns on YTD basis. We can see the clear winner is the Aerospace & Defence which is part of the Industrials sector. Industrials, Communications and also Technology sectors have done well on year to date basis as illustrated by the below histograms.

Stocks Outperforming the S&P 500
Stocks that were in favour by investors last Friday and outperformed the S&P 500 index daily return.
Stocks outperforming the S&P 500 on 3rd July 2025 before the long weekend.


Markets
Dollar
Dollar topped at the beginning of 2025 exactly from the resistance levels the patterns had forecasted. Our target is 95 to 94.90, the Dollar index futures (DX) have been as low as 96.
On the daily chart you will see that the market found support from the 1.618 expansion. Based on the pattern formations in the EURUSD and GBPUSD which have either met our targets or came close to the targets we had, the chances are rising that as long Dollar index futures remain above 96 we are likely to see sideways to a stronger dollar, however, the bearish symmetry is still in play, we could the dollar rise to next resistance zone of 97.50 to 98.20.
Dollar Index futures weekly chart


Long term monthly chart of Dollar Index (Futures). Look at that time symmetry in the market.

Cable - GBPUSD
Last week we mentioned that GBPUSD missed our target of 1.3800 by about 30 pips. The daily chart showed the pair was at the 1.618 expansion and found resistance from that level to close down by one big figure last Wednesday. Cable found support from the 20 day moving average and recovered some of the losses but still closed the week lower by about -0.5%.


EURUSD
EURUSD reached our long term target of 1.1750 last week. Now the pattern is complete, but we do not see any sign of reversal yet. This is the area we will be paying close attention to. The market is likely to consolidate in this area between 1.180 - 1.20 as dollar likely gets down to the level mentioned above in the Dollar index chart.


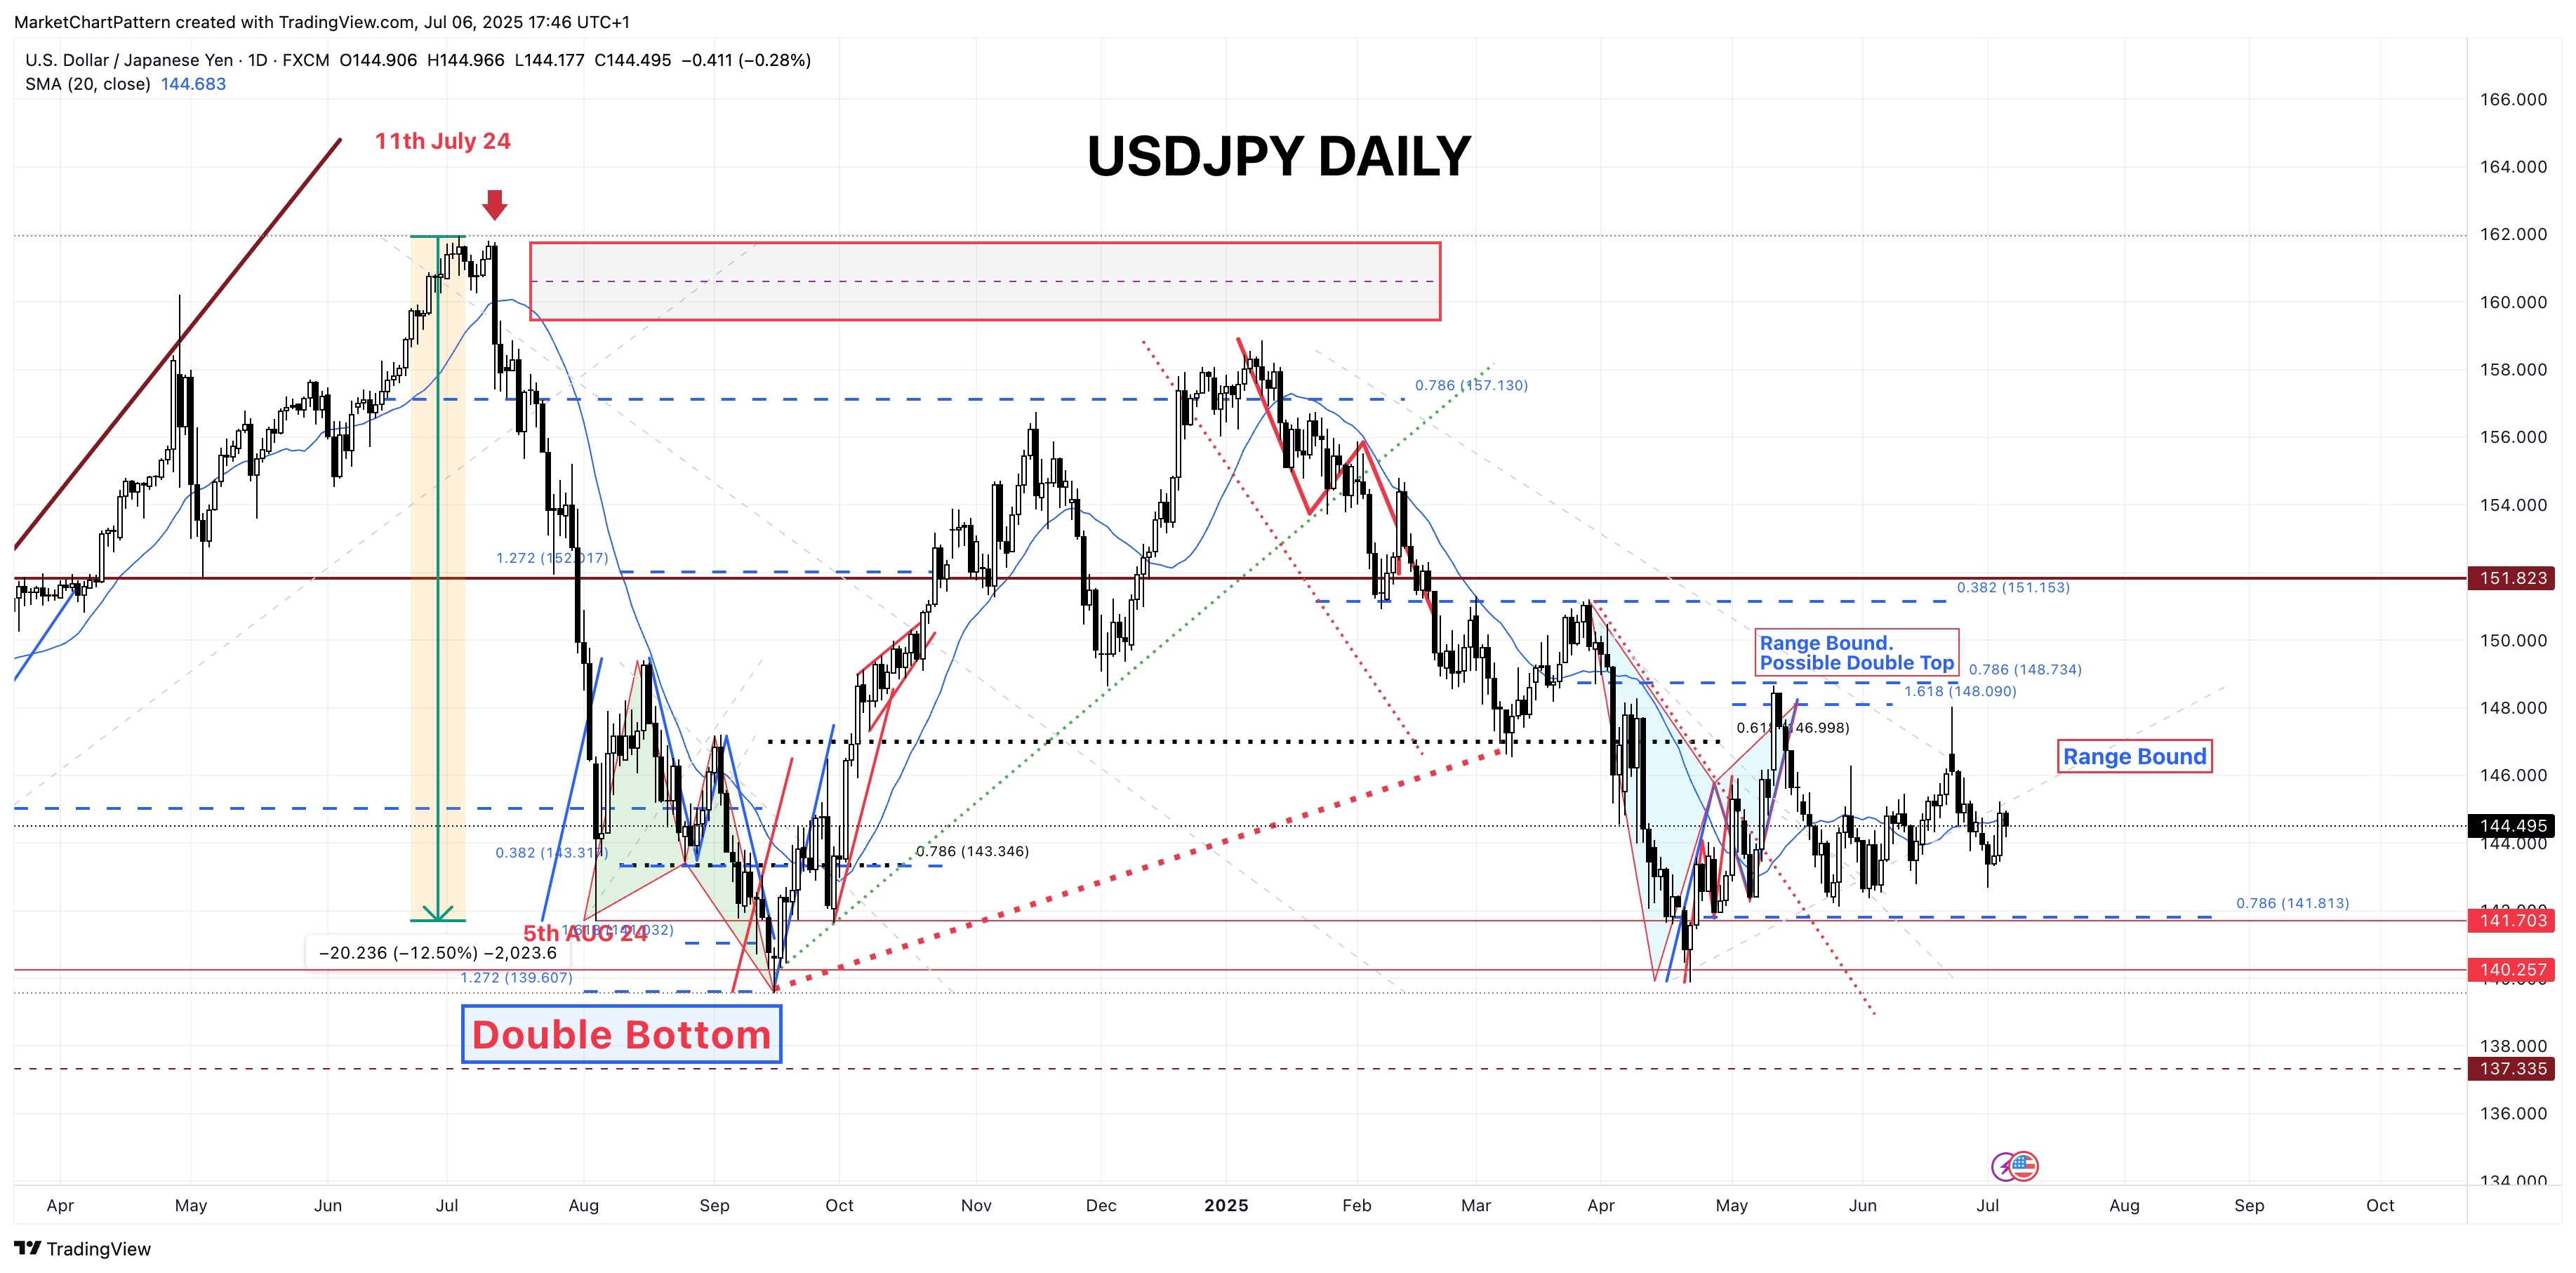
USDJPY
This market remains range bound.
Bitcoin - BTCUSD
Bitcoin remains supported as long as it remains above the 38.2% Fibonacci retracement level and that ab = cd pattern formation. Notice, the price reclaimed the dotted red trend line.


Debt Markets
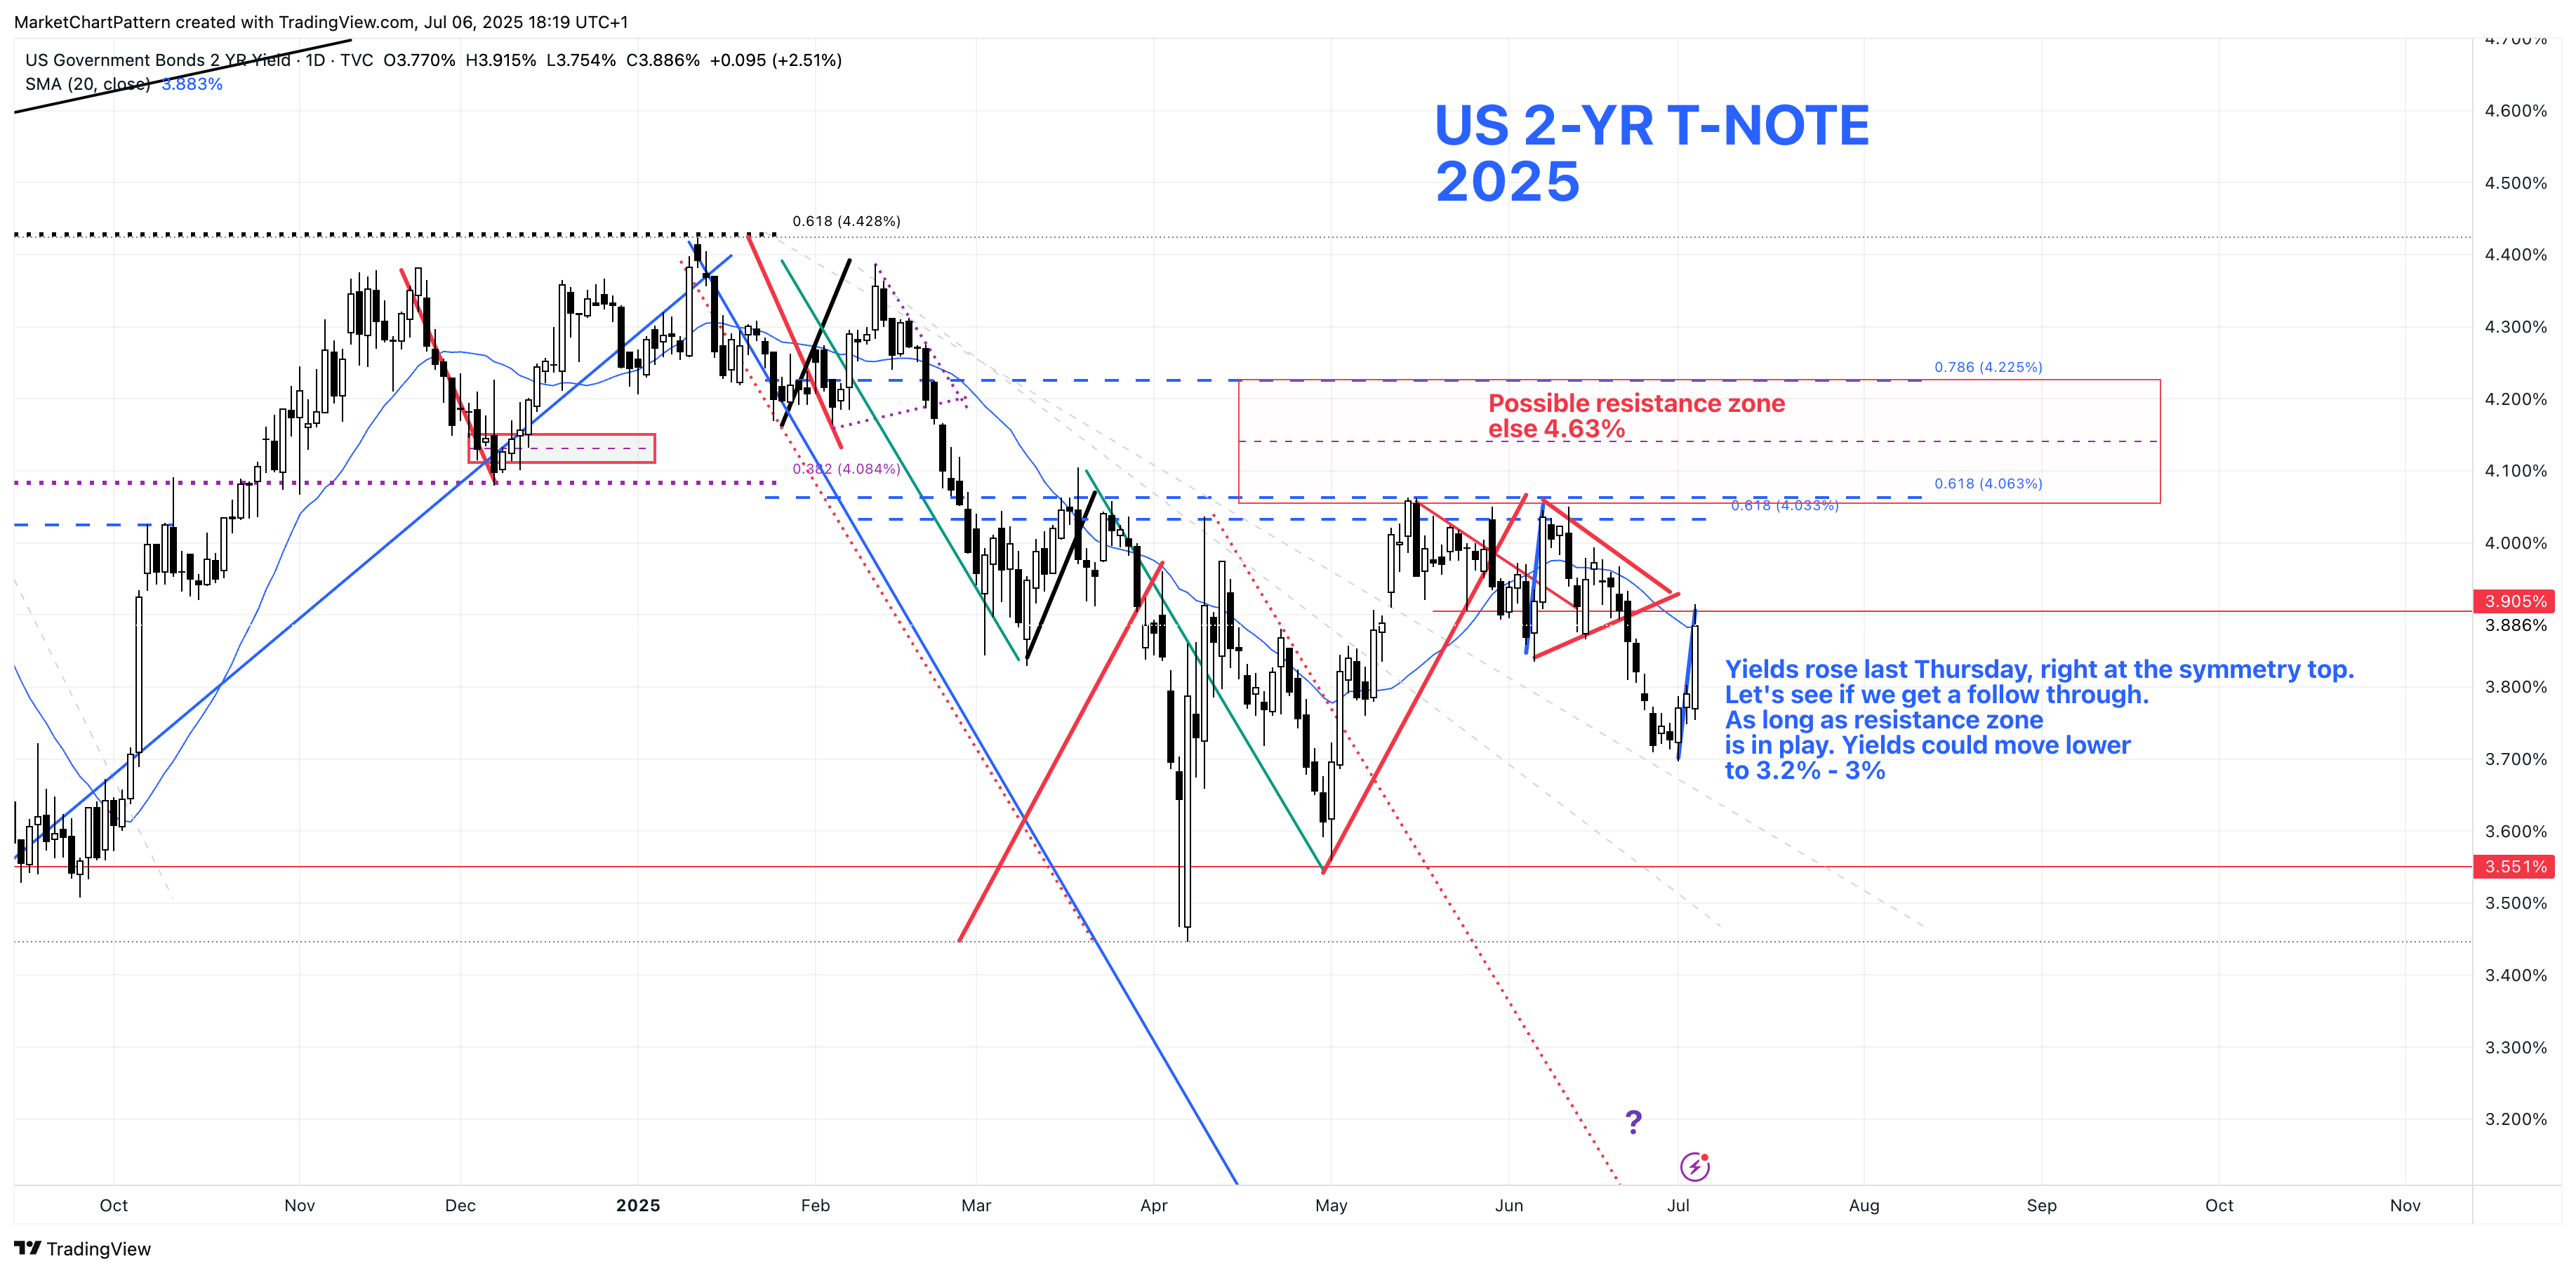
2-Year Treasury Note
2 Year Treasury Note yield rose last Thursday by 2.51% which is quite a dramatic increase, however, we have seen the market make such a move before and then there is no follow through. For example, 6th of June 2025, market had a similar move but then there was no follow through.
This bearish market symmetry is still in play and the market closed right there as could be seen on the daily chart with the blue line. Let’s see if we get a follow through.
On the weekly chart, we can see, the market is in this triangle pattern and last week found support from the 200 week moving average. The pattern will break either way soon.

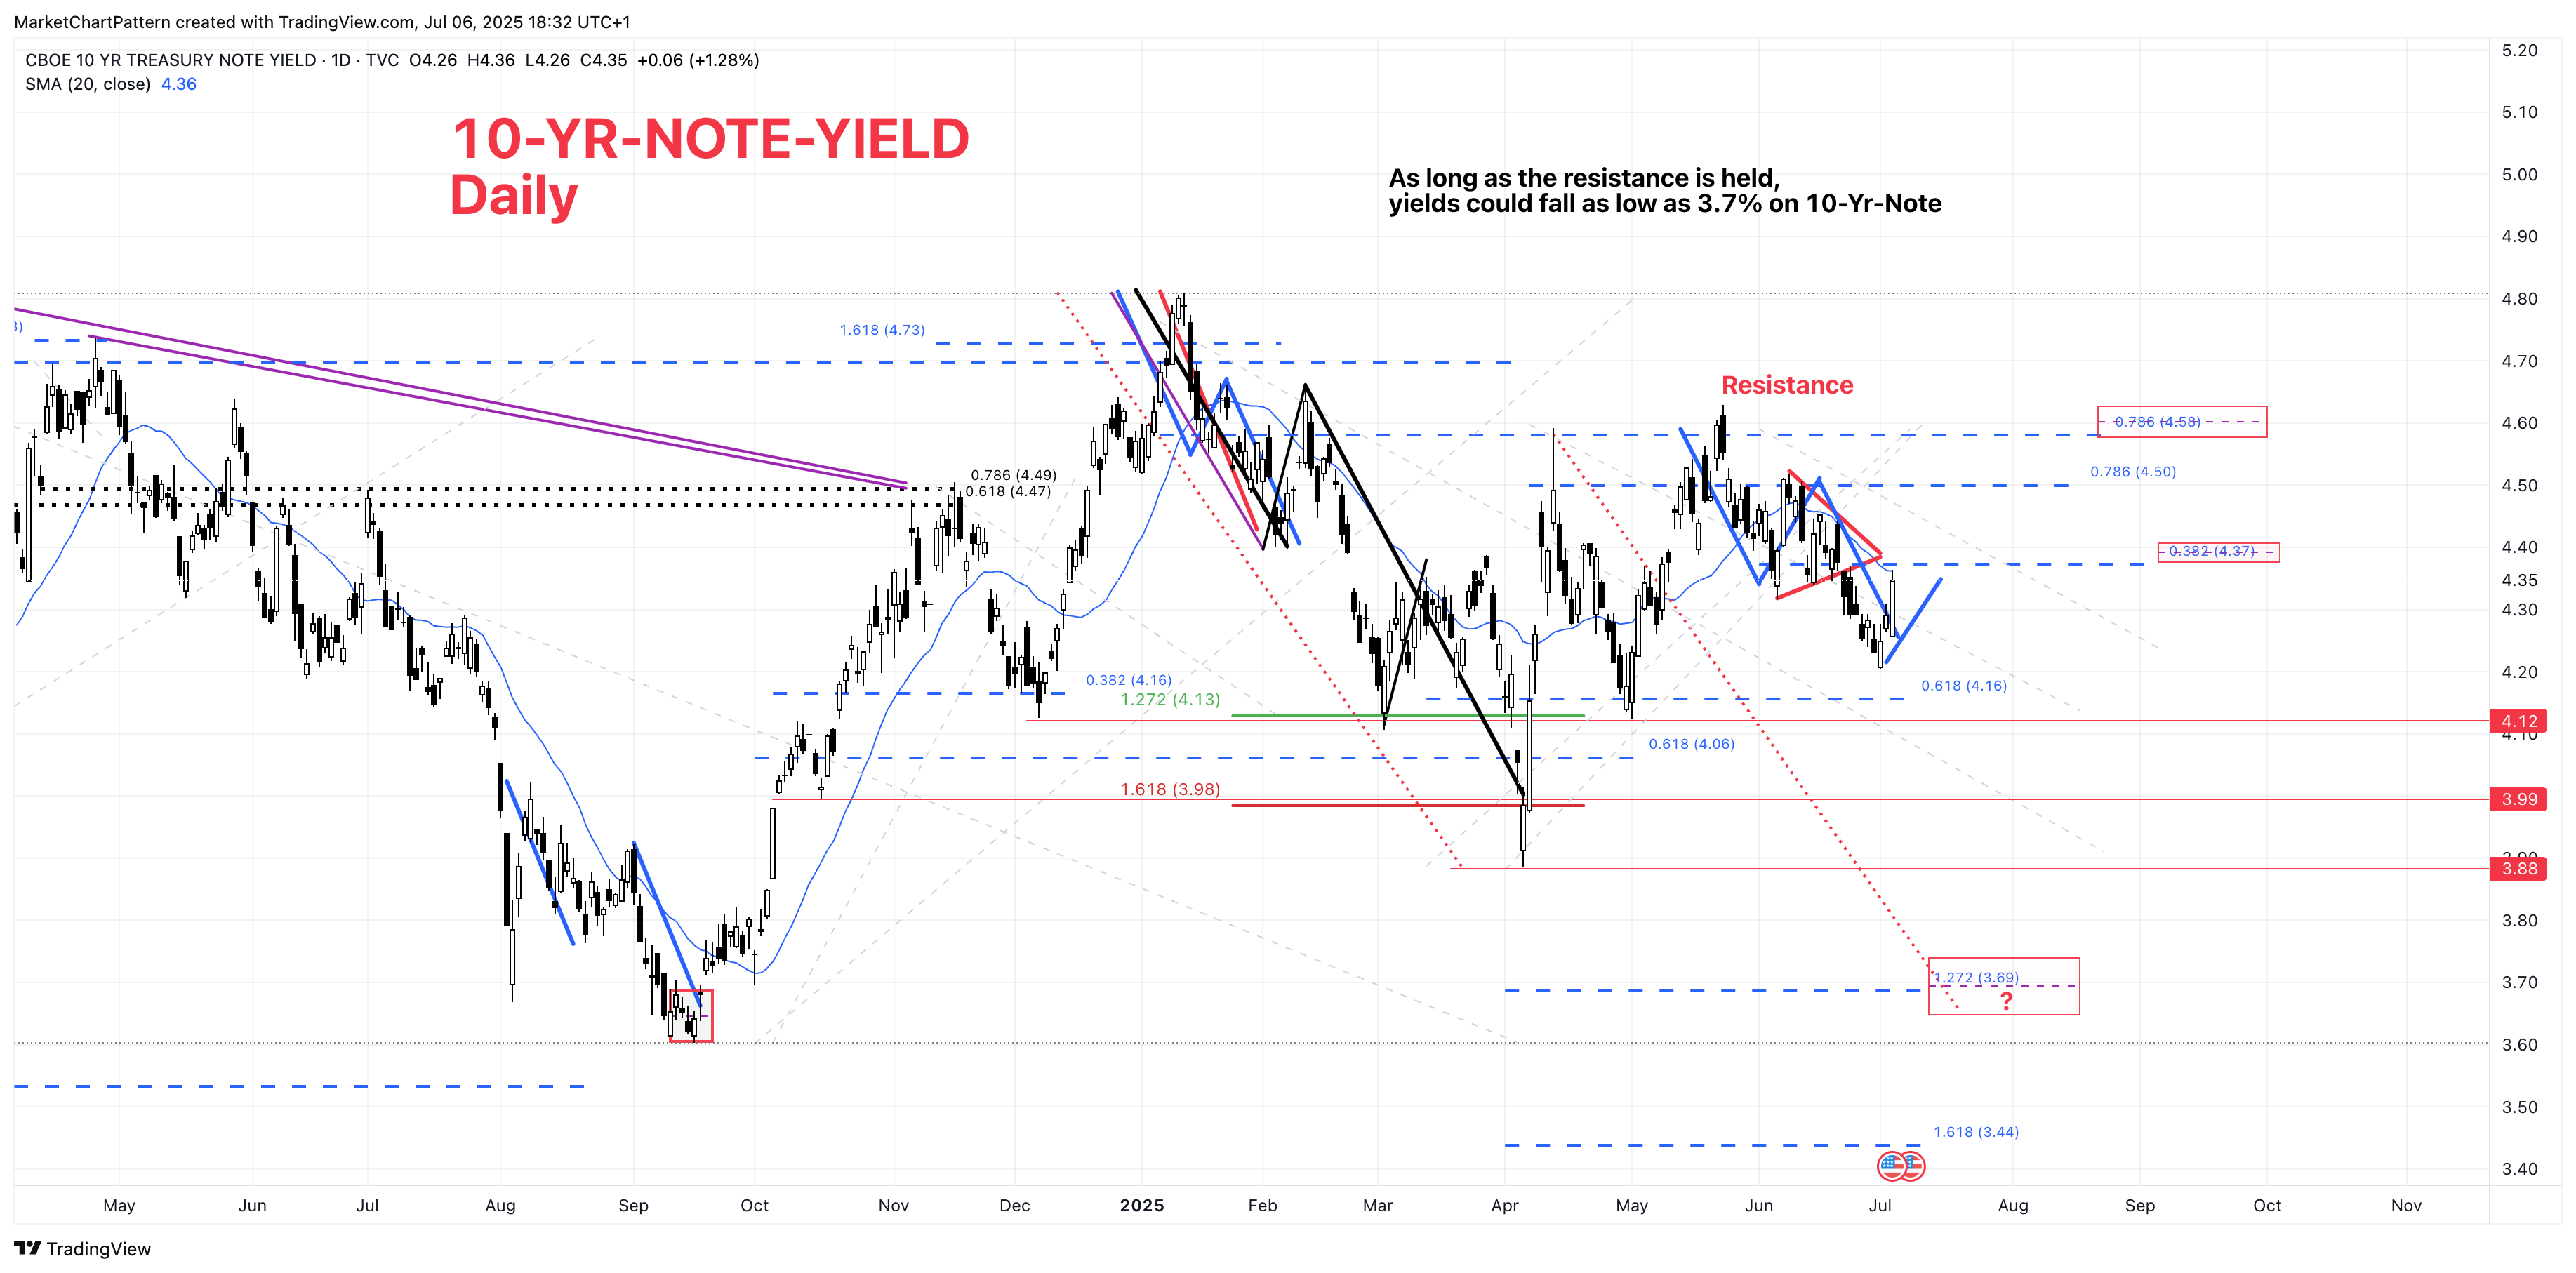
10 Year Treasury Note
Last week we wrote, ‘10 Year Treasury Yields also fell last week, however, last Friday, it completed a small ab=cd pattern and we have seen the yields rise for the day. Perhaps, the yields could rally a little bit.’
This is what we saw happen in the market. The yields rose right into the 38.2% Fibonacci retracement at 4.37%. Let’s see if we get a follow trough to the upside, or this resistance rotates the market lower.

30 Year Long Bond Yield
We have seen the yields drop at the long end of the yield curve as can be seen the yield put a top at 5.15% where we had strong resistance based on the shaded pattern formation. Yields went as low as 4.79%. Based on the harmonic pattern shown by the blue line, we could perhaps see a rally in the yields to 4.93%. Getting above 4.93% would target 5% level.
However, the yield touched the 20 day moving average and could find resistance from this level.

Comex Gold
Last week in the Sunday report we wrote:
“Gold closed lower for the past week. On the daily chart of Gold, we had been watching the dotted red trend line. The trend line has been broken last week. However, we do have a rather broad area of support that is our next zone of possible support. This comes between the $3250/oz to $3190/oz. A $60 range which is now the new norm for the Gold market as it can easily move $40 to $80 in a day.”
Then next Monday, Comex Gold retraced lower and printed a low of $3250.5/oz, right at the top of the support zone and rallied over $100/oz.
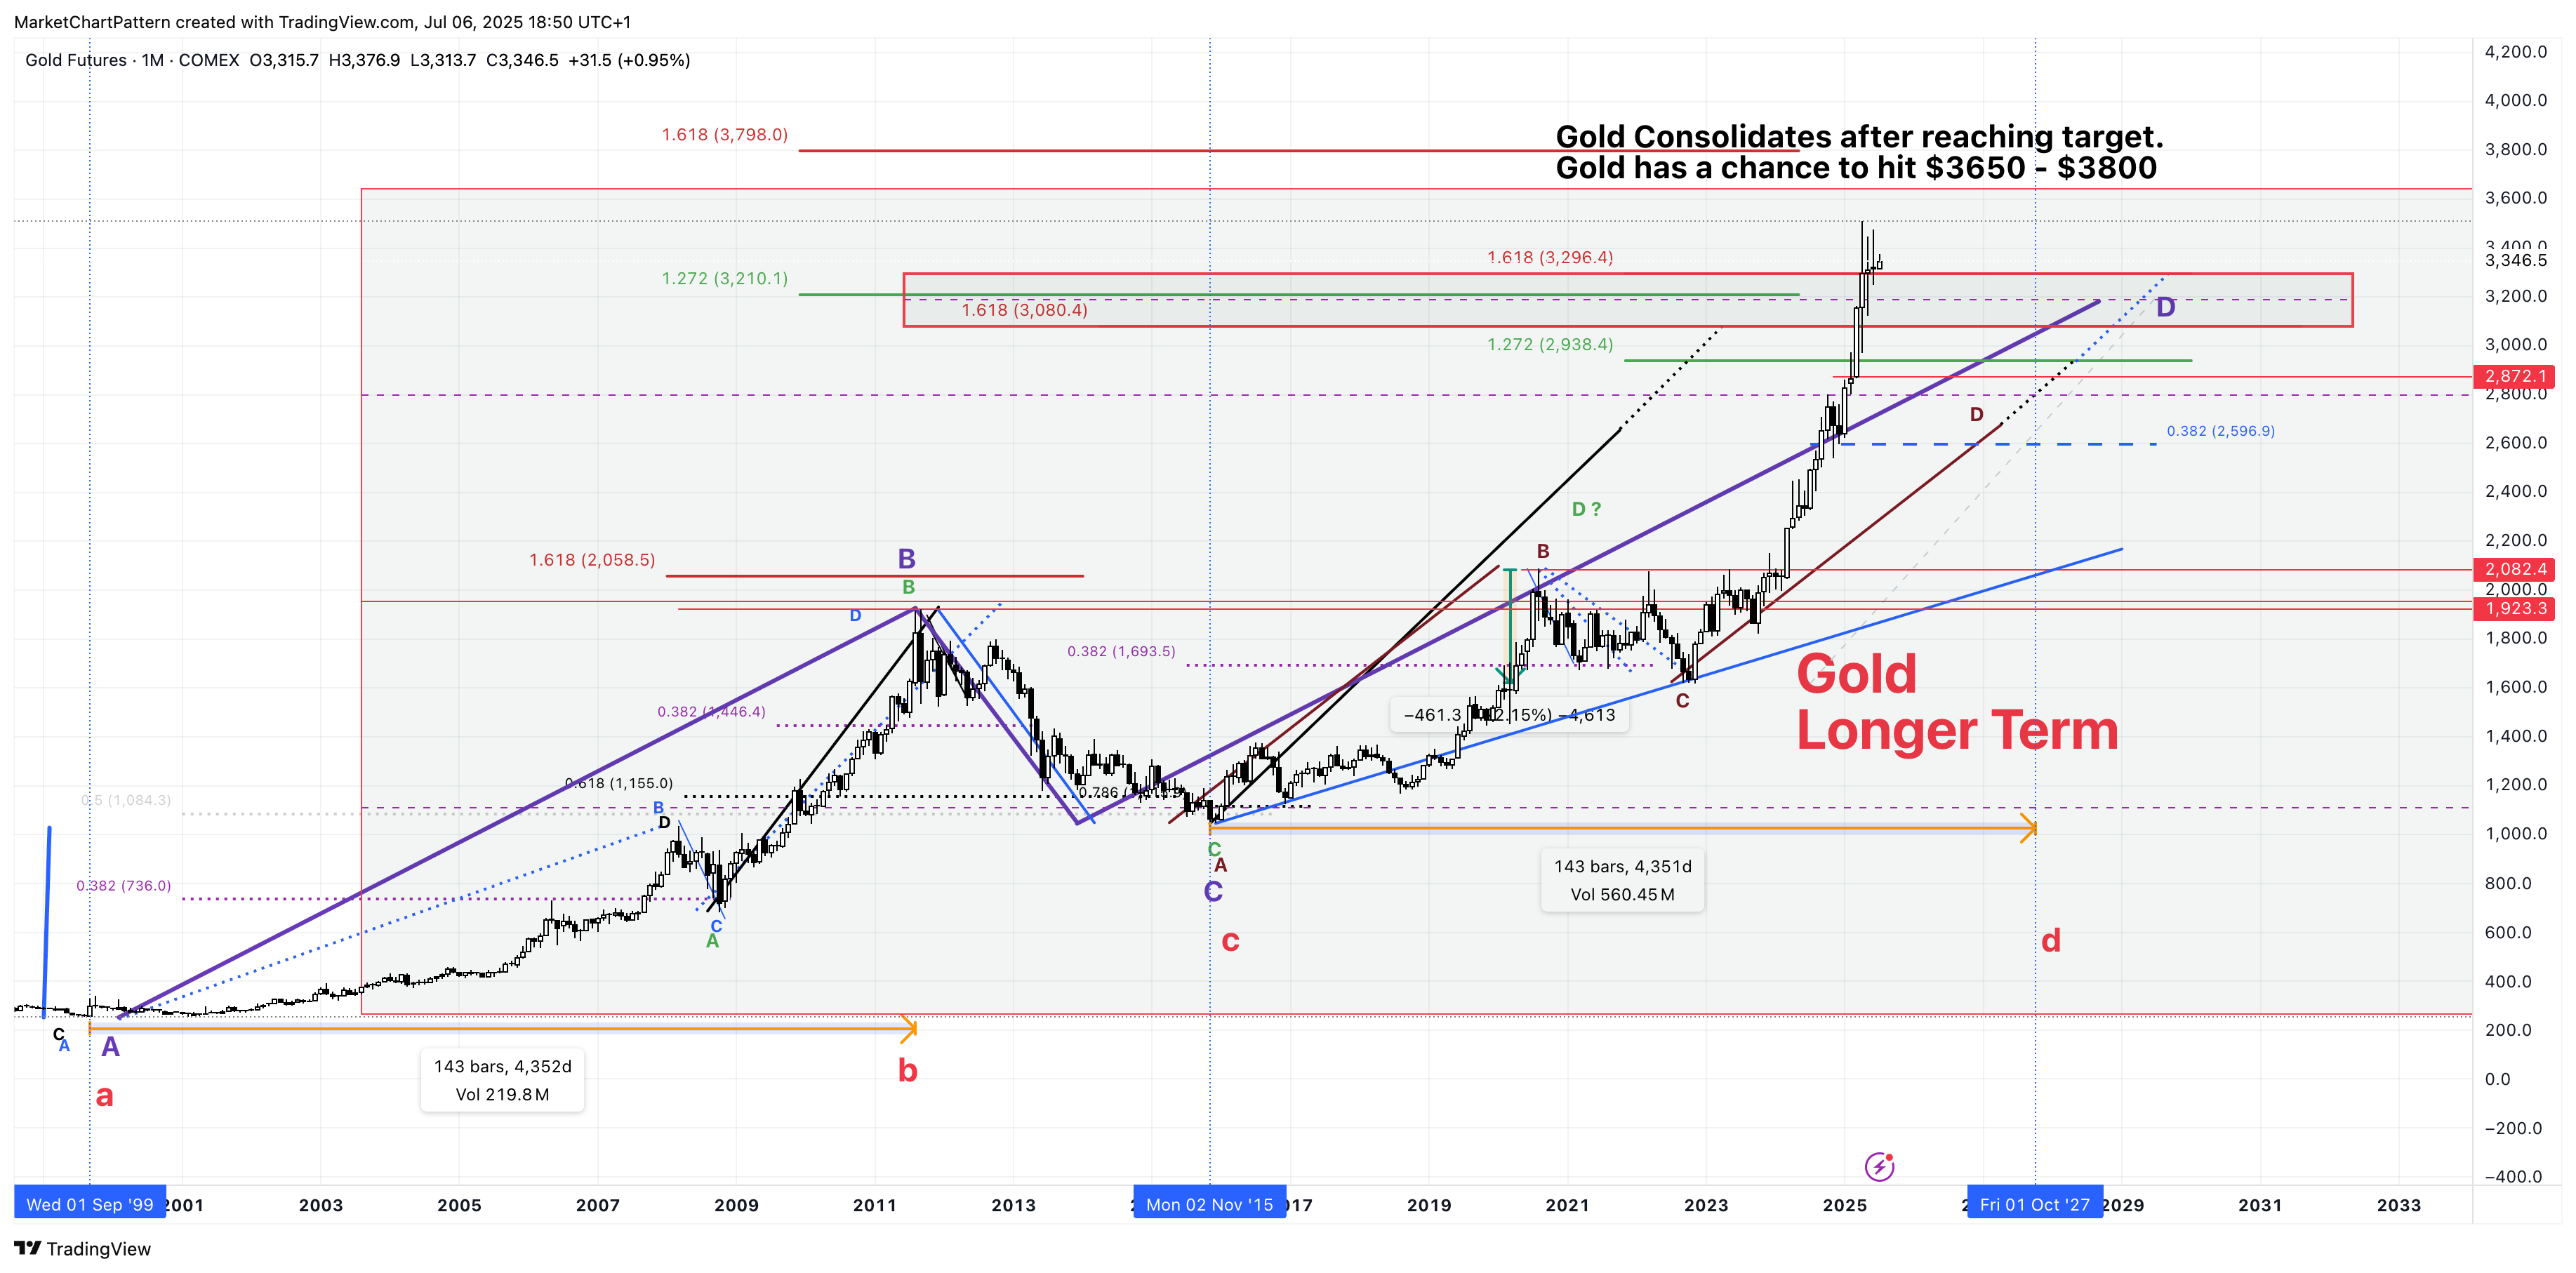
The $64 question is where is the price likely to go next? As long as our support zone is held, we have a bullish bias for Gold. If, last Monday’s low at $3250.50/oz is the point C of 1:1 price projection, then we have a shorter term projection into $3550/oz to $3600/oz levels.


Monthly chart projects higher target for Comex Gold.
Comex Silver
Silver market is getting stronger and weekly chart represents higher targets.


World Markets
Hang Seng Index

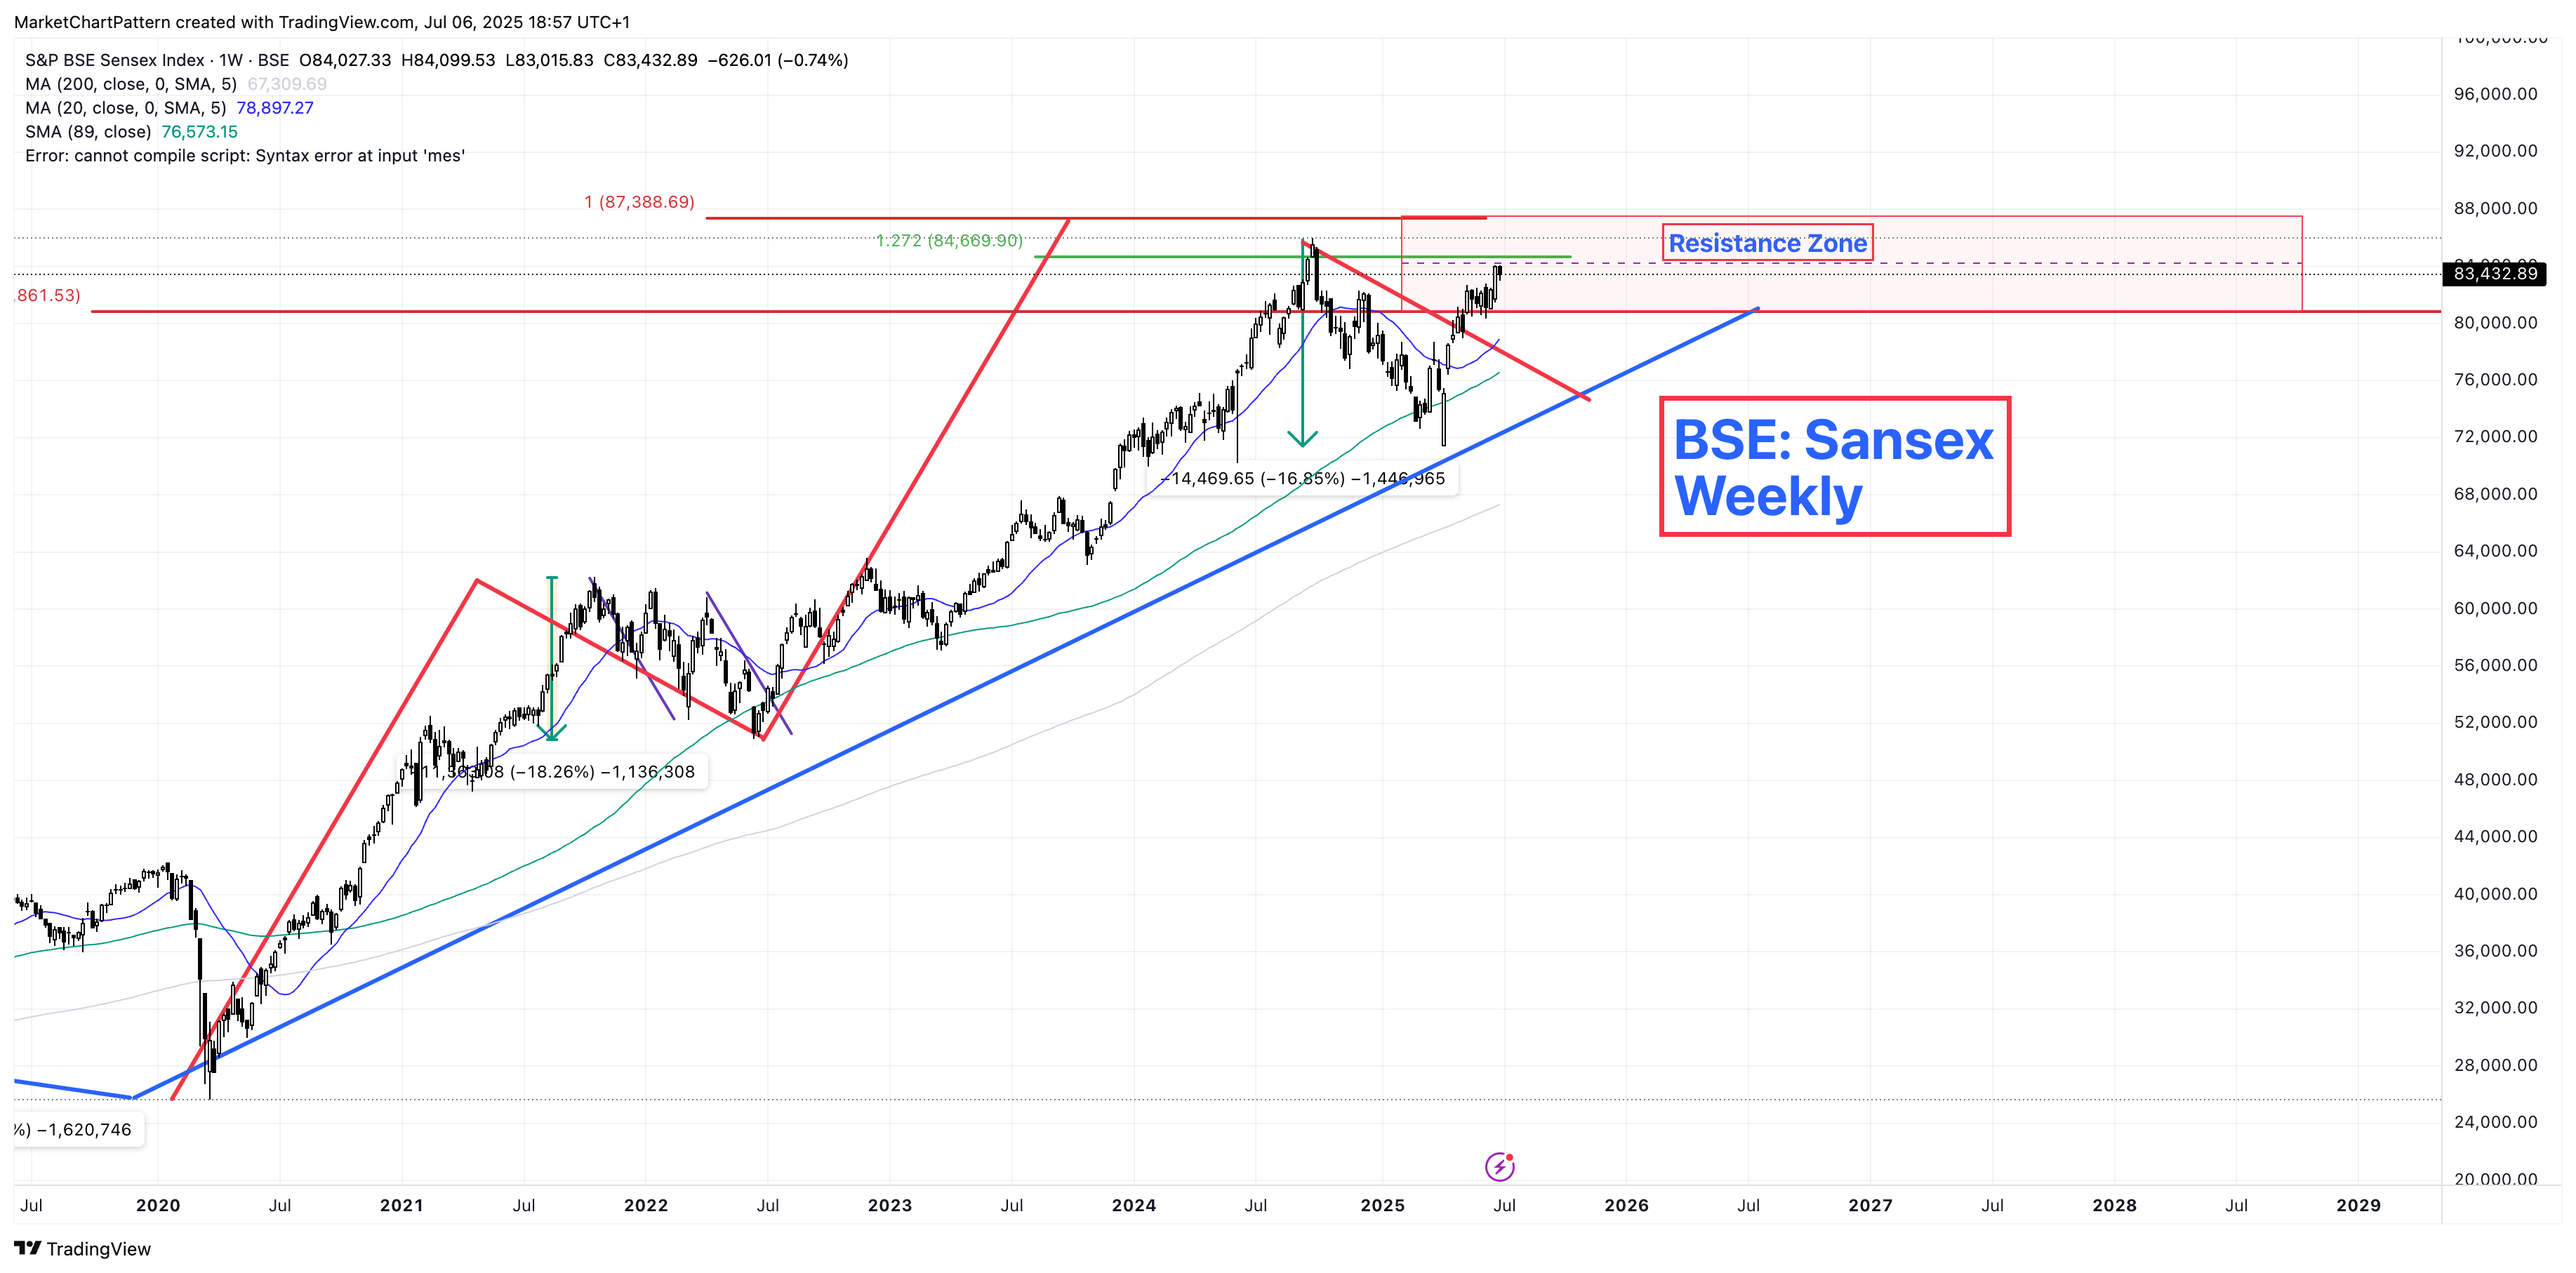
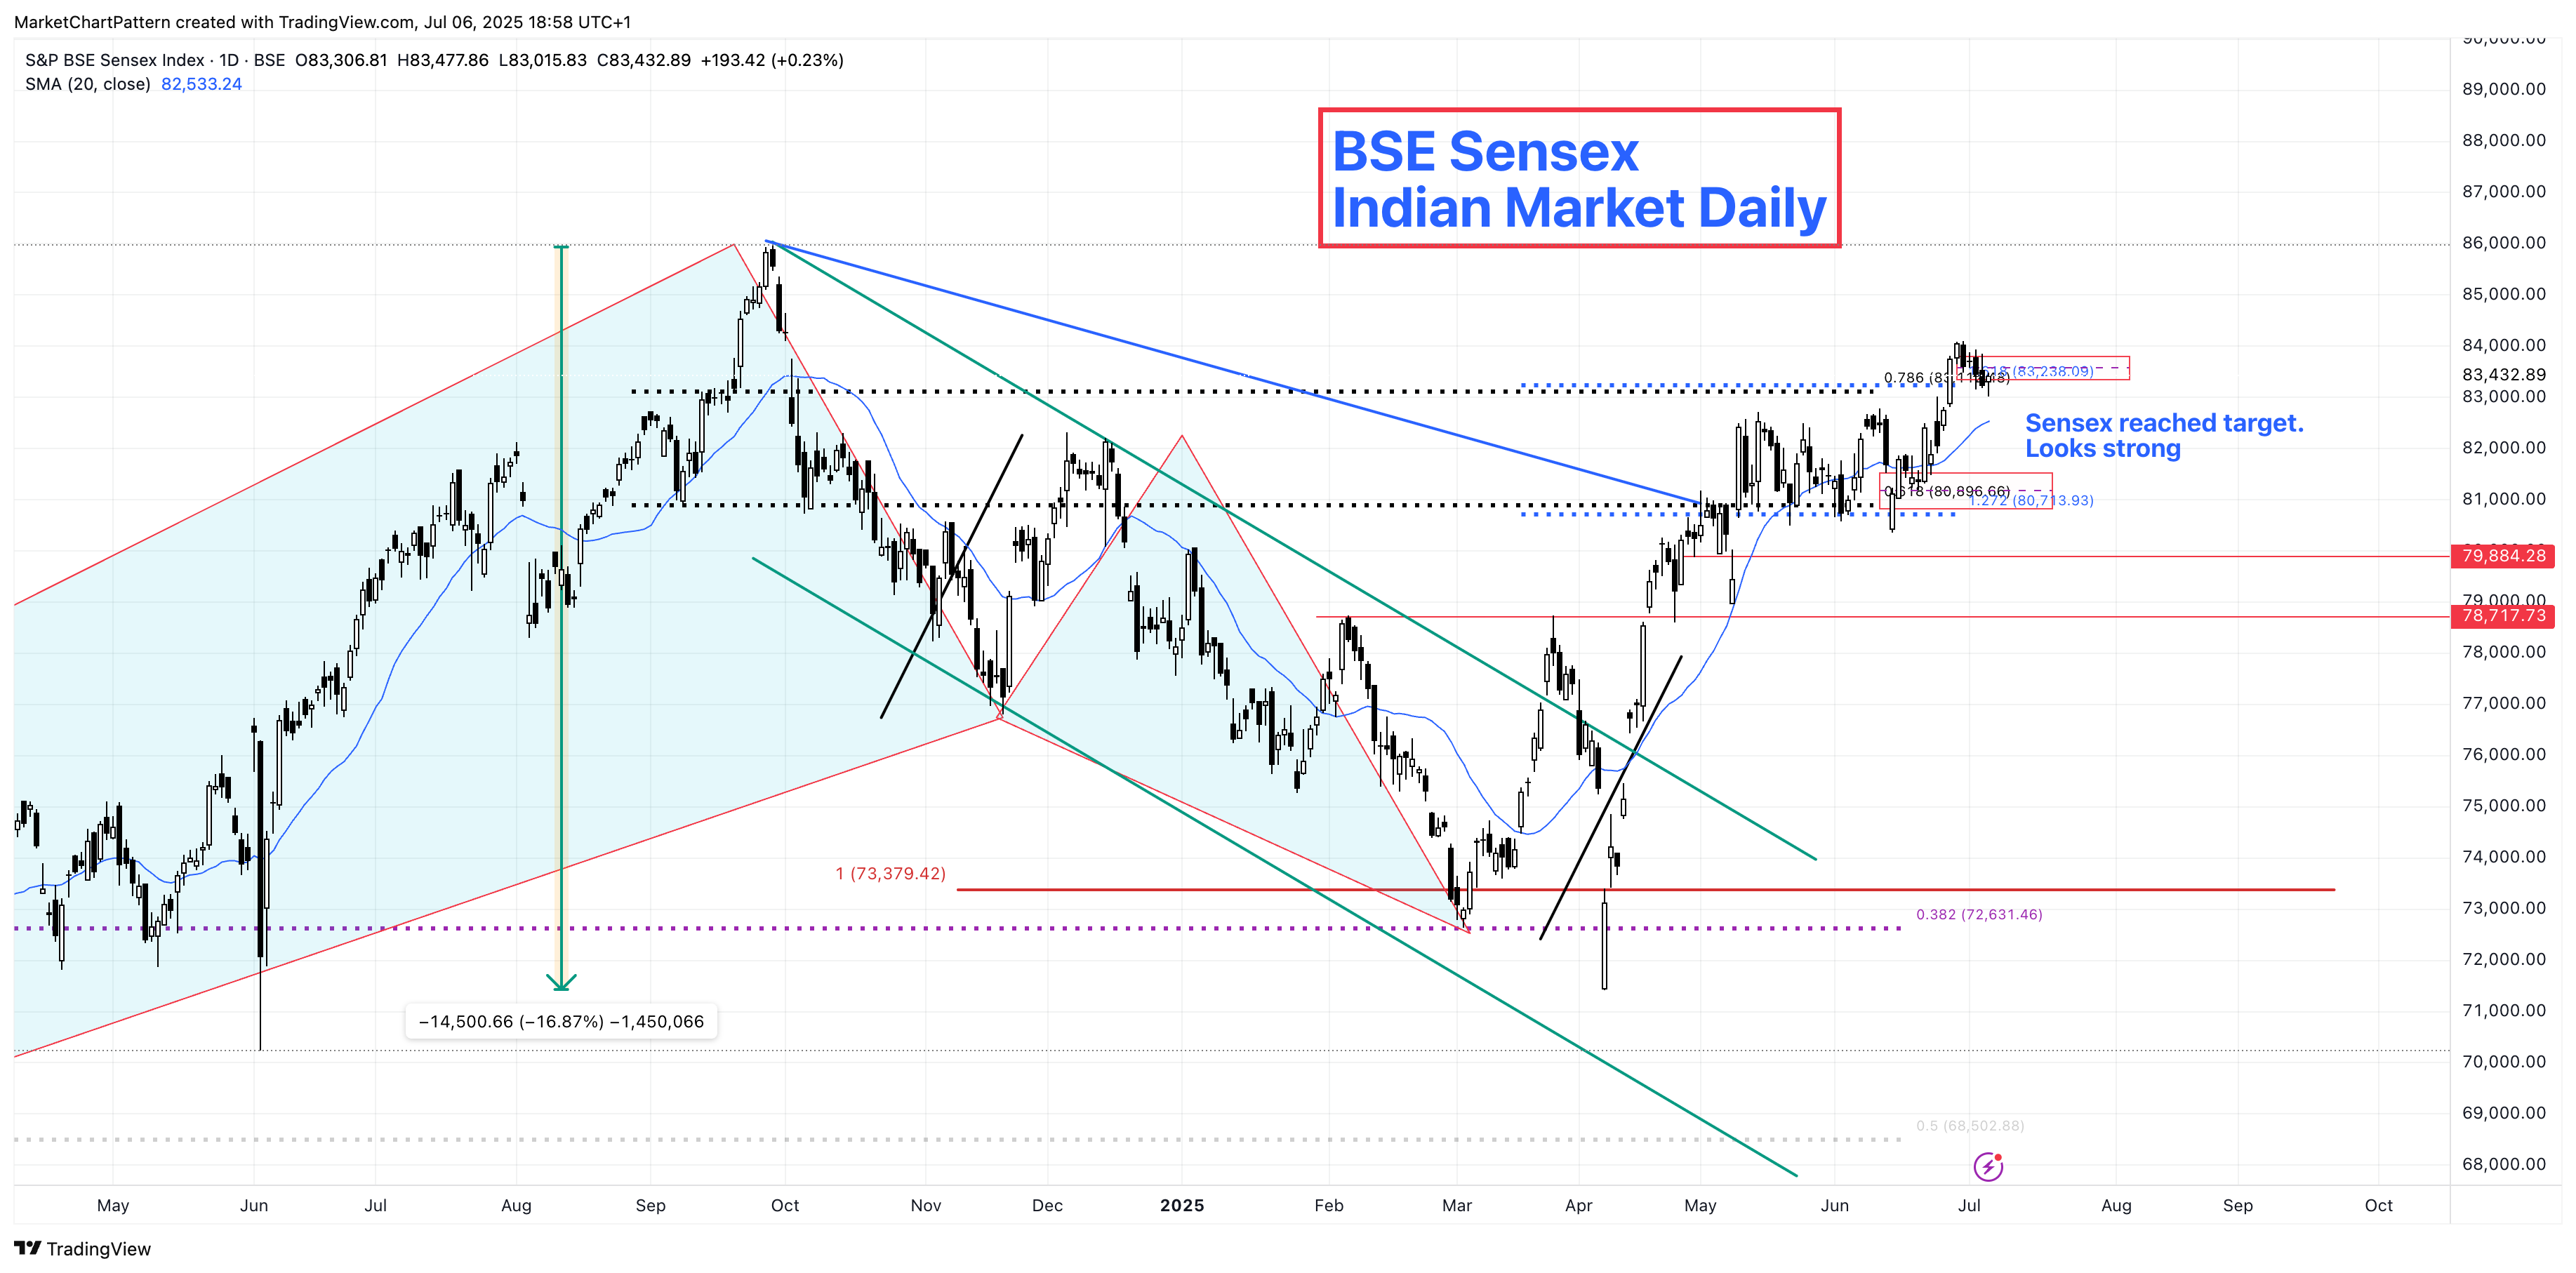
India’s Sensex Index
German DAX
The price action in German DAX last week was disappointing as the market just went sideways.
On the daily chart, the price went above the 20 day moving average and remains support from a momentum perspective. However, we are beginning to see the signs of market consolidation here particularly for a market which has performed really well in 2025 thus far.


UK’s FTSE 100

US Markets
US markets on YtD basis have recovered all the losses and are now positive for the year as shown in the histogram charts above for the major indices we follow.
Major US stock indices like SPX and NDX closed at new all time highs to celebrate the 4th of July long weekend.
Let’s review individual markets and see based on pattern recognition, what the markets are likely to do next.
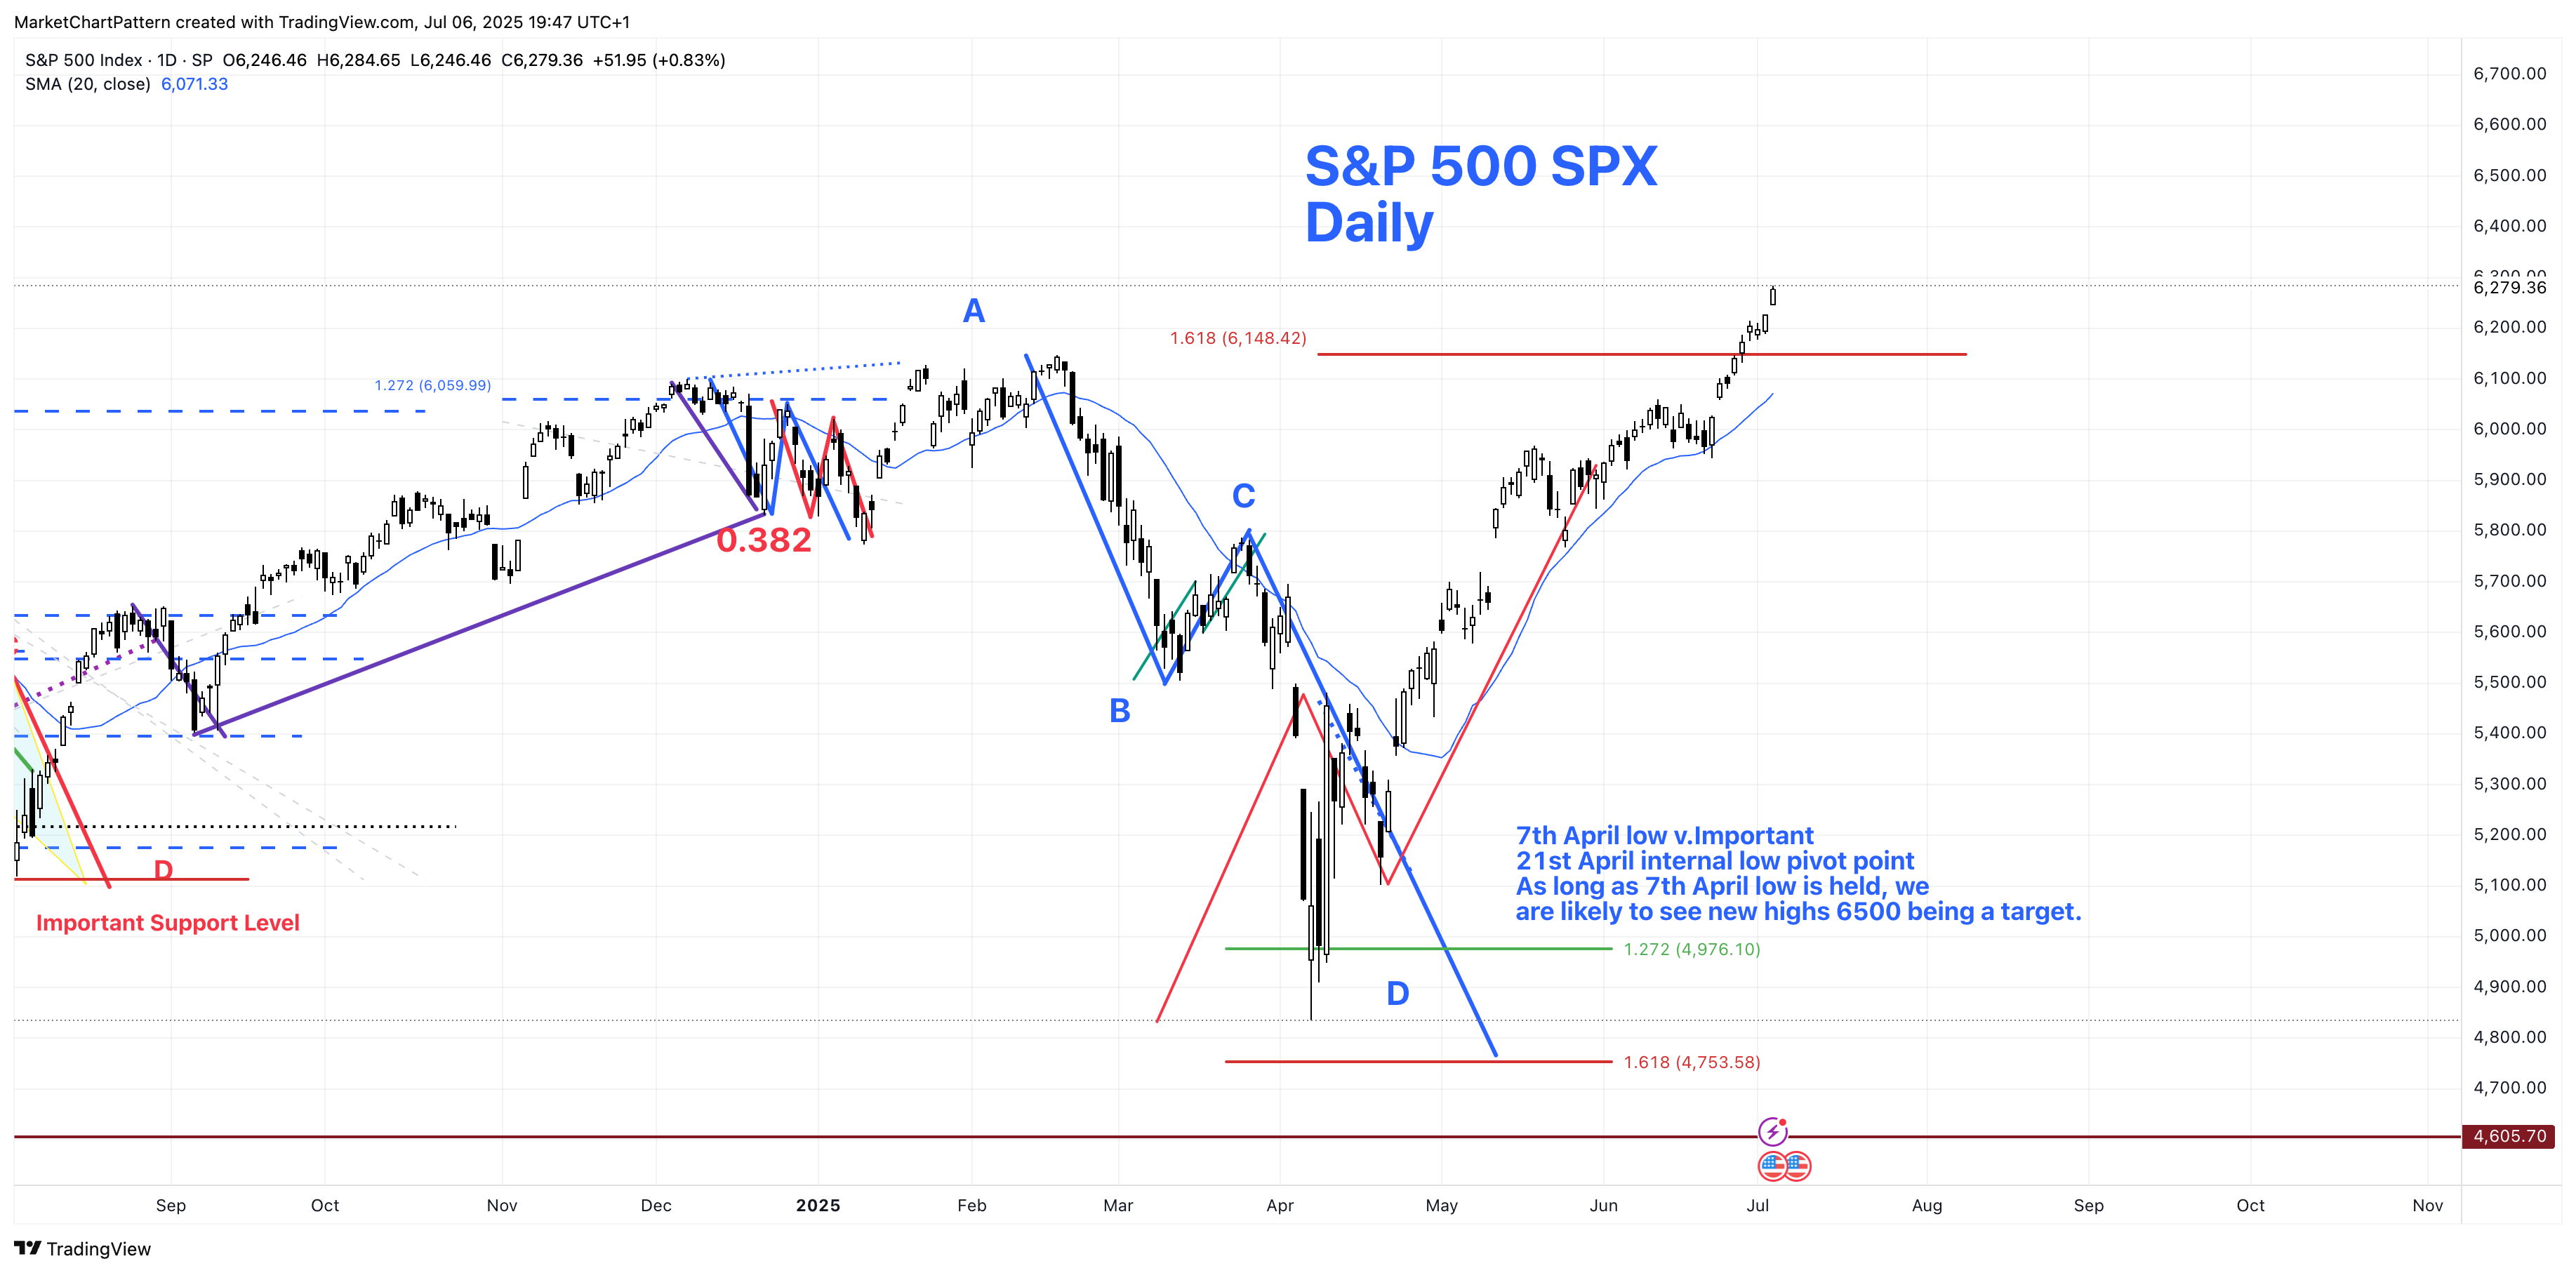
S&P 500 Cash SPX
S&P 500 made new all time highs last week. This would have been a very difficult scenario to perceive back in April of this year. However, this is exactly what we were saying that chances were, we might have seen the low as we had a pattern completed both in price and time on the 7th of April. When price meets time the pattern is complete!.
Higher targets for 2025 are 6500 which is the shorter term target and the markets in 2025 by the close of the year could target 6955 as illustrated in the weekly chart below.
However, from the lows of 7th of April 2025 lows, the SPX is up 29% in a V-shape recovery. 6500 would take this gain to about 35% which is a big gain in a short amount of time. This leads us to believe that during the summer time the markets might begin to consolidate. In some of the European indices, which had been leading the US indices, we are already beginning to see this as we enter the summer time.
Next key timing for us come at the end of August/beginning of September.

Last week we mentioned ‘..Range bound roughly between 6100 - 5700. Whilst this scenario could still play out, we are watching to see the breakout could lead to 6500 first. ‘
It appears the market might see the 6500 on the SPX first. However, last Friday, when the cash markets were closed but the Globex was open, we saw the ES futures contract pullback by about 50 points. It is, therefore, important to watch the futures charts which I am attaching below.


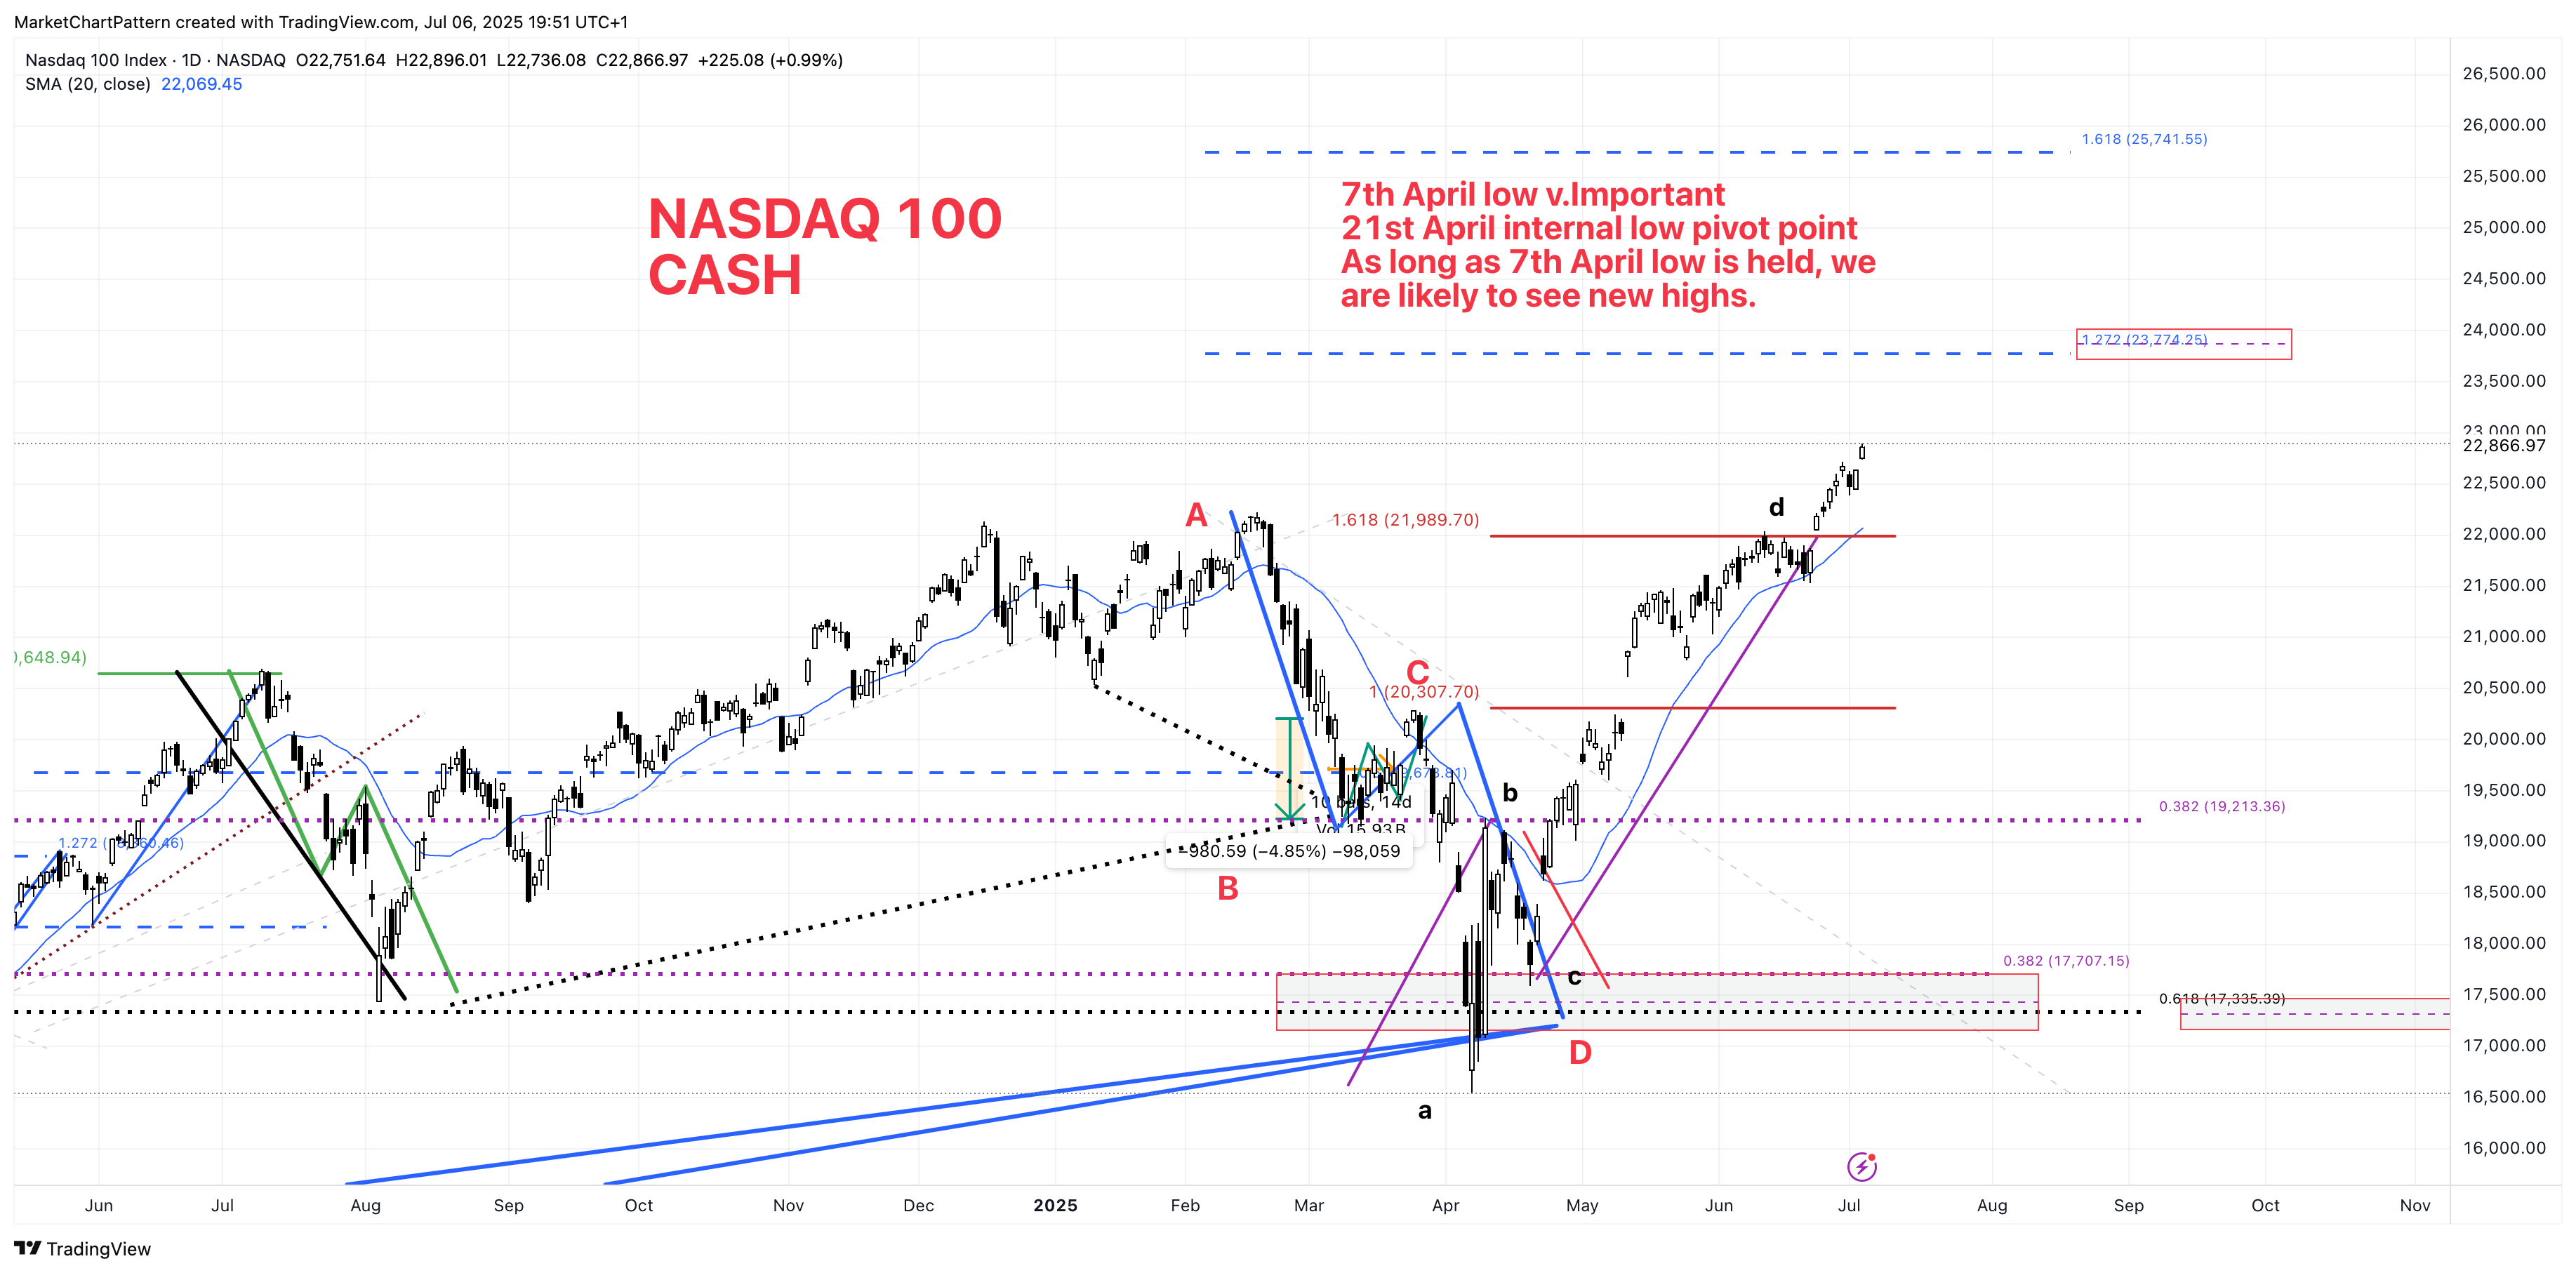
Nasdaq 100 Cash - NDX
NASDAQ 100 also made a new all time high last week. Charts illustrates the further possible targets.
However, as illustrated in the weekly chart, the price is reaching the shaded region which is our target but the market could begin to see consolidation.

Disclaimer
This post, any text used in the post, any images, video, audio and links be it internal or external are for information and educational purposes only and not a financial advice.