Markets Daily 16 July 2026: Tech and Semis Lead the Selloff, Defensives and Energy Buck the Trend, and European Indices Hold Ground

Summary
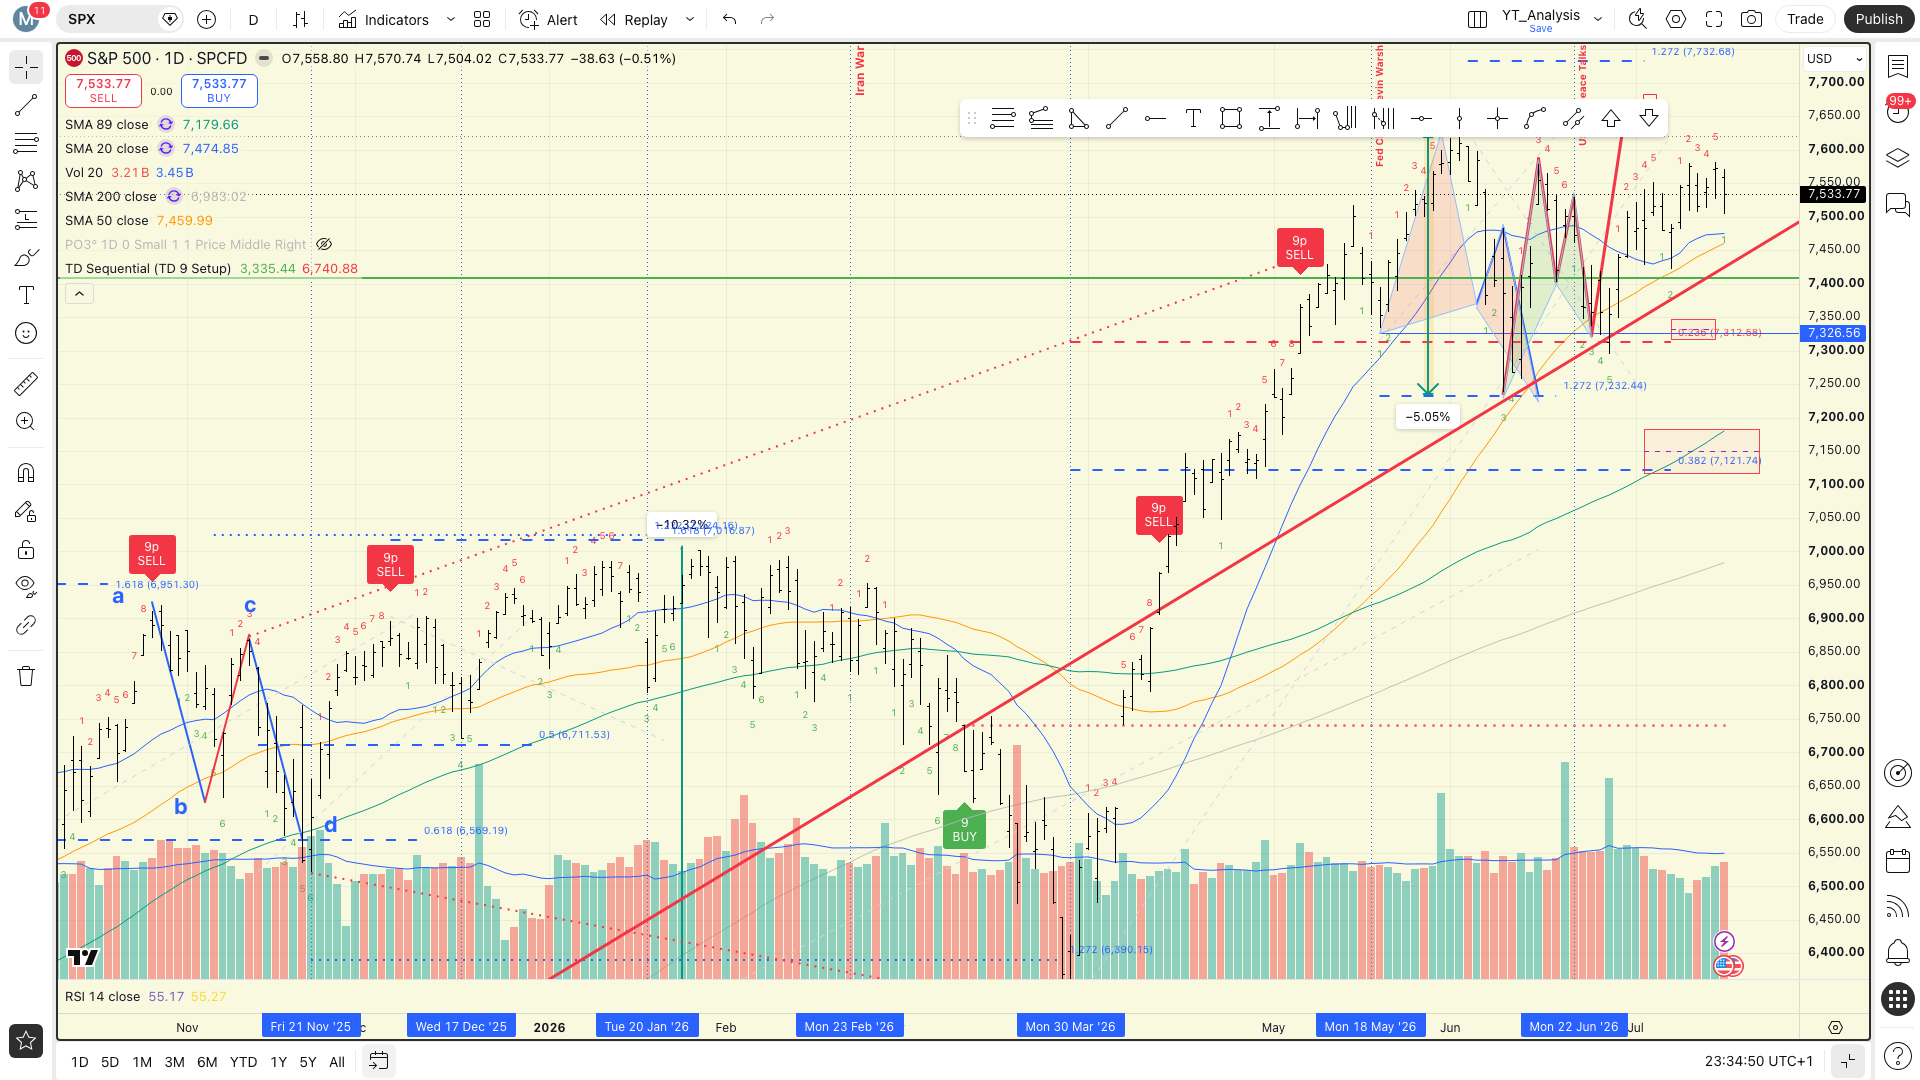
S&P 500 (SPX) → down -0.51% to 7,533.77 · large-cap growth dragged lower by technology; defensives cushioned the fall
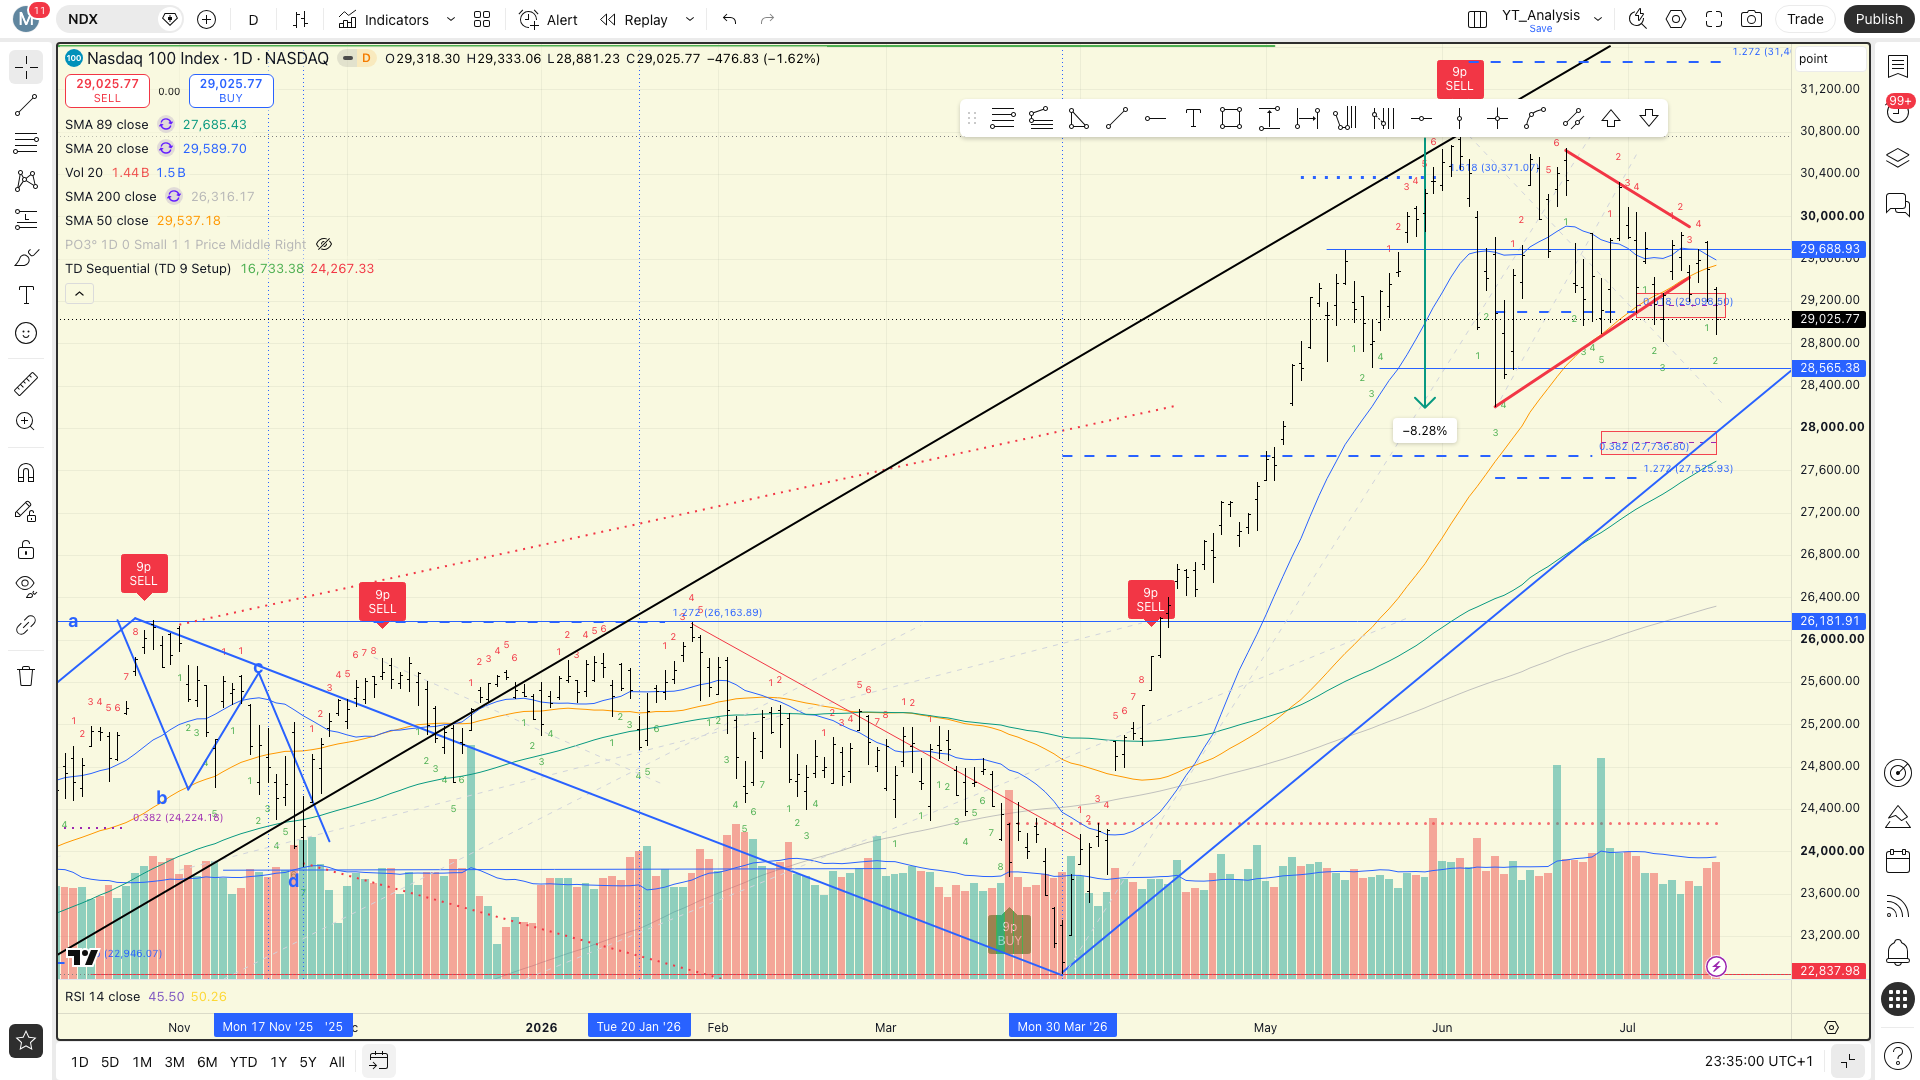
NASDAQ 100 (NDX) → down -1.62% · ran into resistance as semiconductor names collapsed; worst US index on the day
Russell 2000 (RUT) → nearly flat at -0.06% · small caps held their ground, continuing to show relative strength
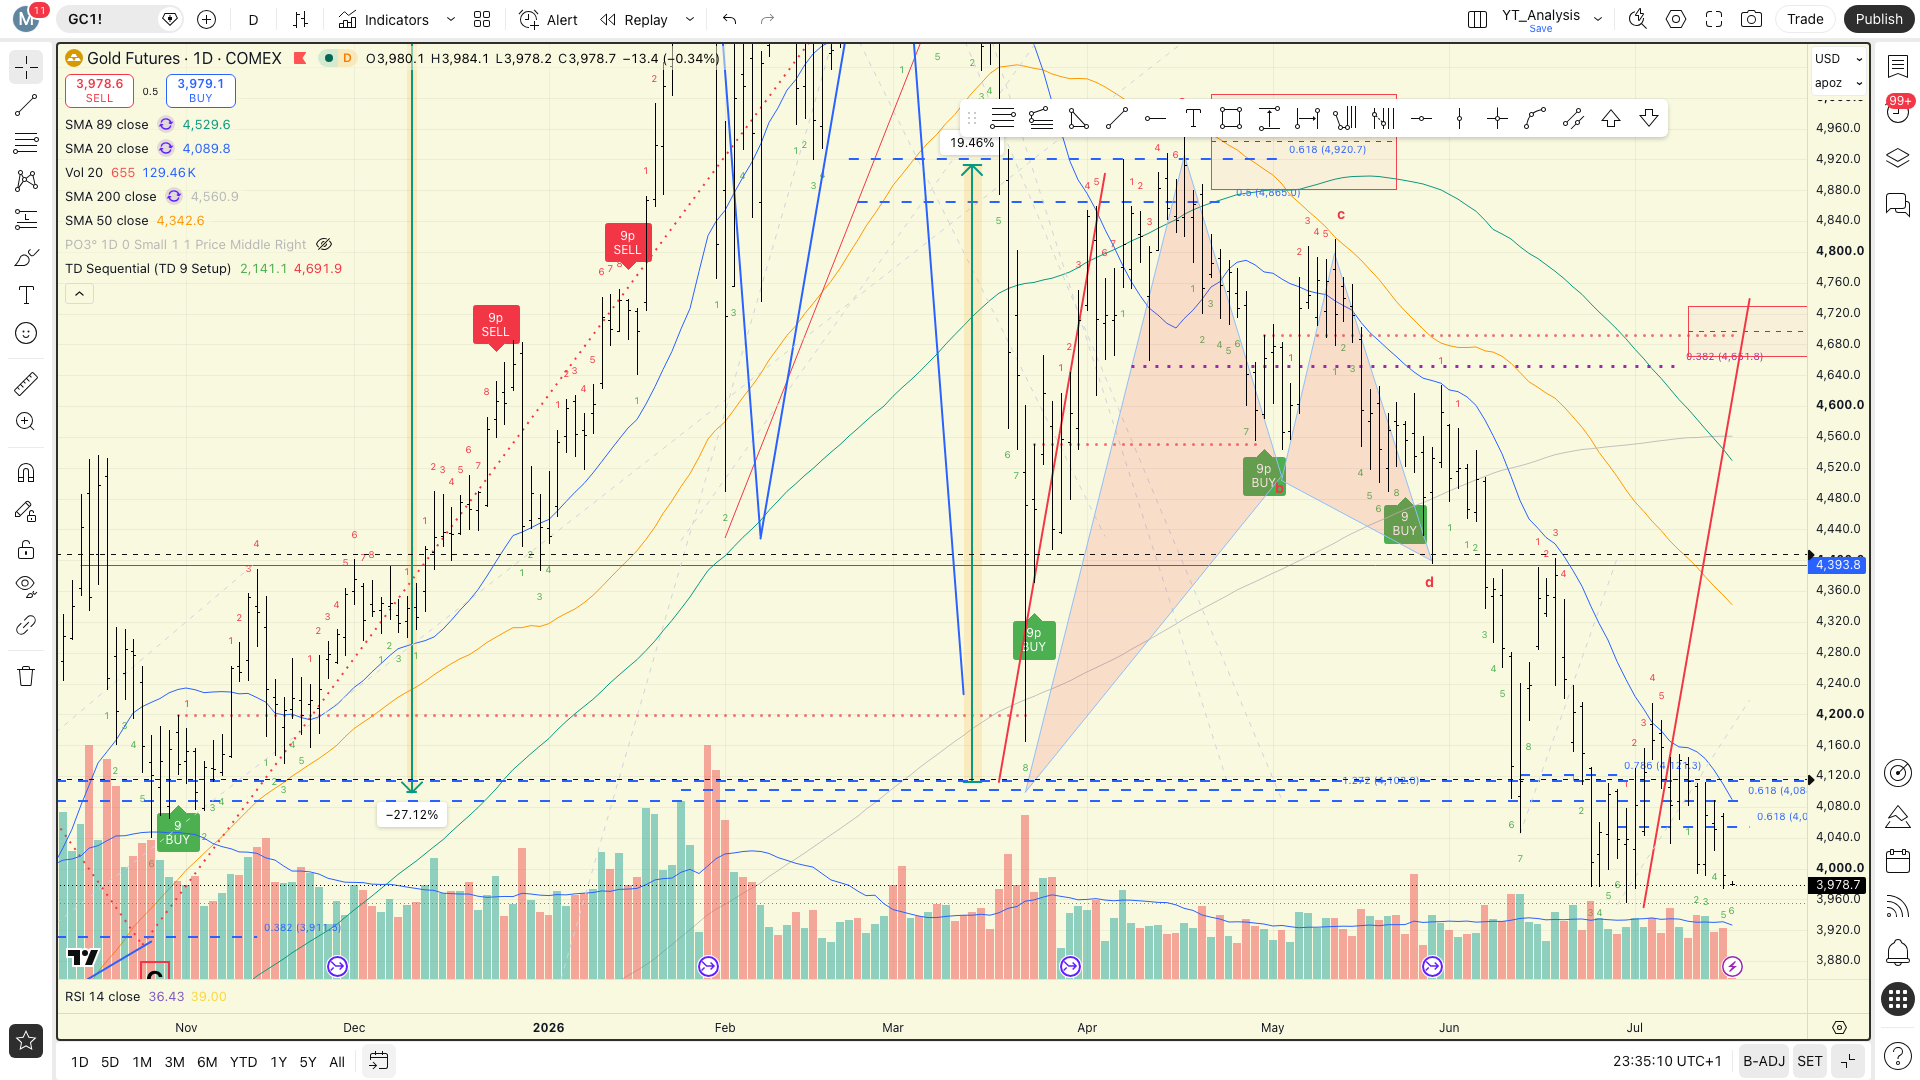
Gold (GLD) → down -1.98% · pulled back sharply; silver (SLV) even worse at -3.49% · commodities under heavy pressure
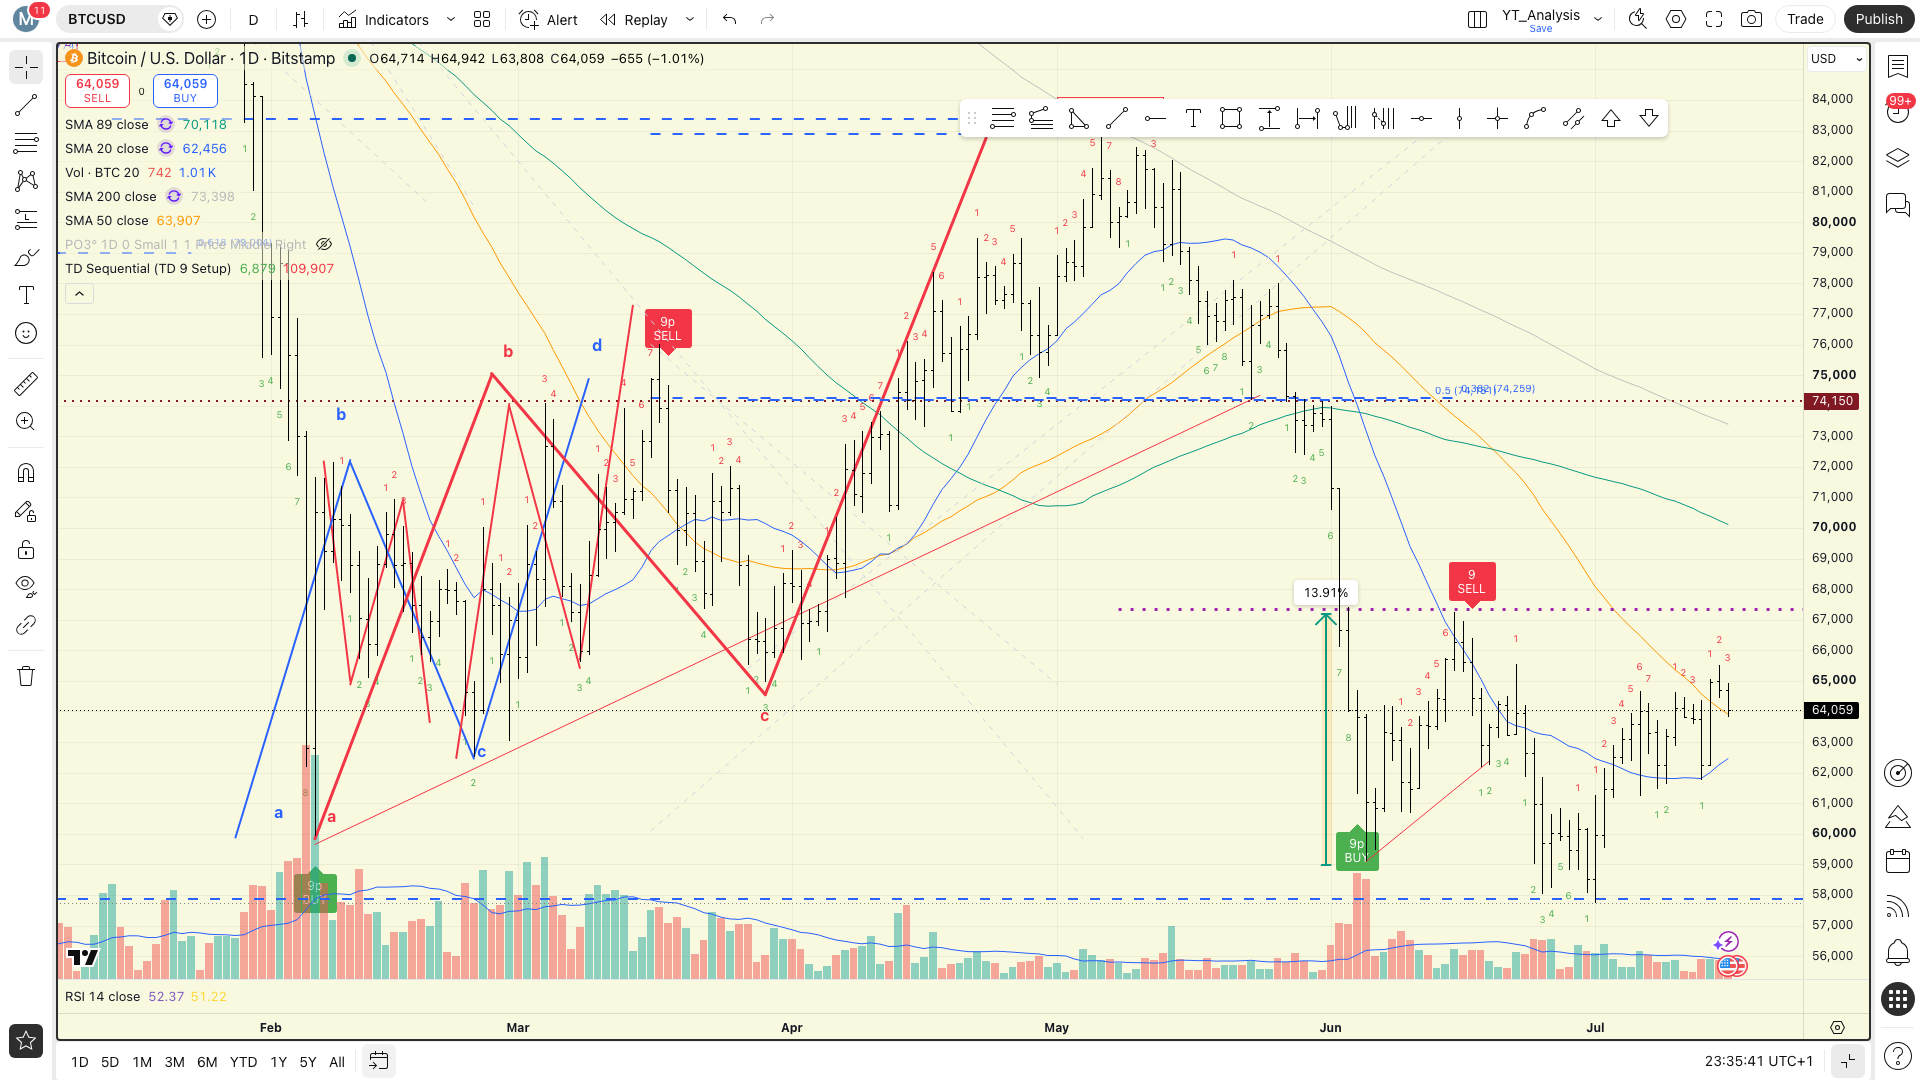
Bitcoin (IBIT) → down -1.14% · gave back ground after a strong MTD run of +9.31%
FTSE 250 → up +1.08% · the standout global index on the day; UK mid-caps led the charge
KOSPI → down -6.37% · single worst index globally; a significant yellow flag for Asia Pacific risk appetite
VIX → up +6.76% to 16.73 · volatility is rising; risk-off tone building beneath the surface
XLP (Consumer Staples) → up +2.80% · top SPDR sector; defensive rotation firmly underway
SOXX (Semiconductors) → down -4.46% · worst thematic ETF on the day; semis are the epicentre of today’s pain
Asset Classes
Cross-Asset Daily Returns
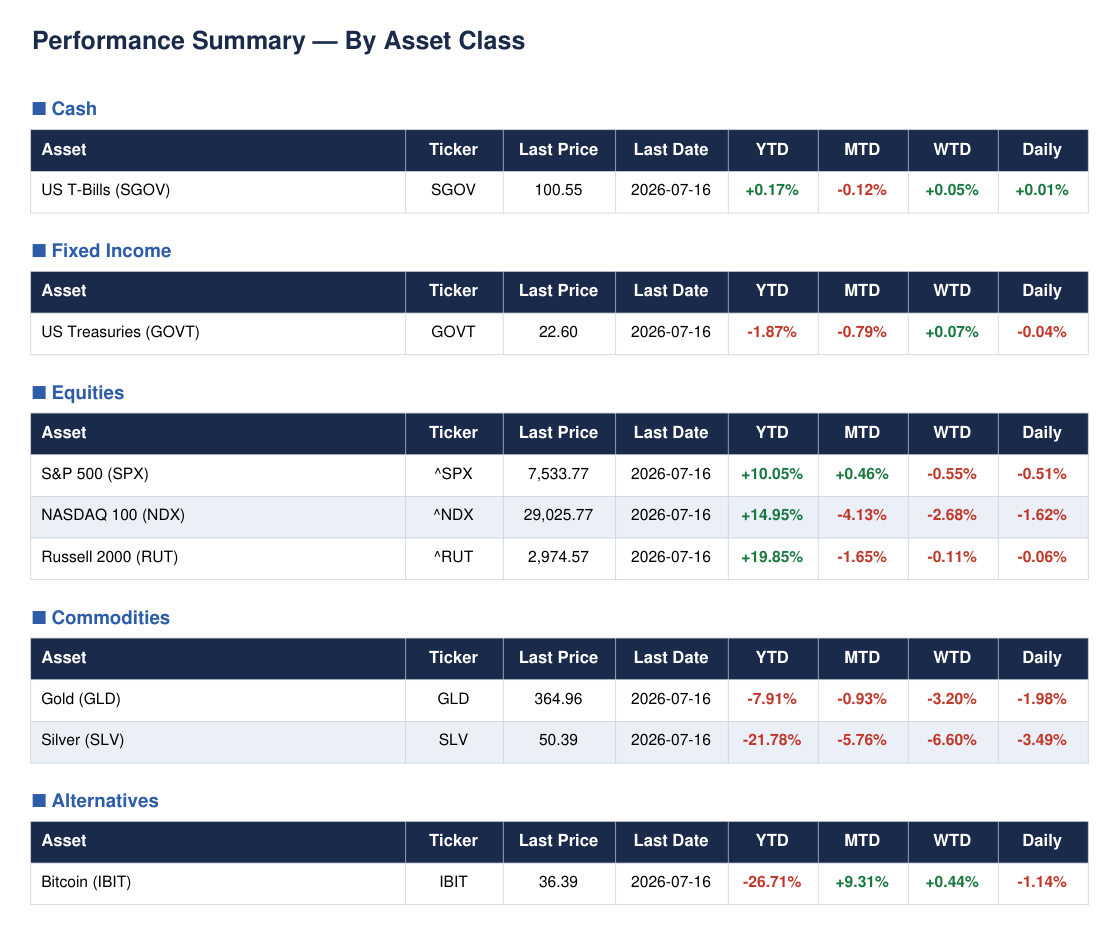
Here is the breakdown. Cash (SGOV, +0.01%) was the only asset class that finished in the green today — that tells you everything about the risk appetite on offer. The Russell 2000 (-0.06%) was the least-bad equity index. The S&P 500 dropped -0.51%, the NASDAQ 100 fell -1.62%, Bitcoin shed -1.14%, Gold dropped -1.98%, and Silver was hit hardest at -3.49%. Eight out of eight assets negative or flat. This is a clear risk-off session.
Performance by Asset Class
Cash was the winner by default, barely positive at +0.01%. Fixed income (GOVT) slipped -0.04%, offering no flight-to-quality bid today. Equities were broadly weaker, with NASDAQ leading losses. Commodities were the worst asset class — both metals sold off aggressively. Alternatives (Bitcoin) also declined. No green shoots in risk assets today.
World Indices
Performance by Region
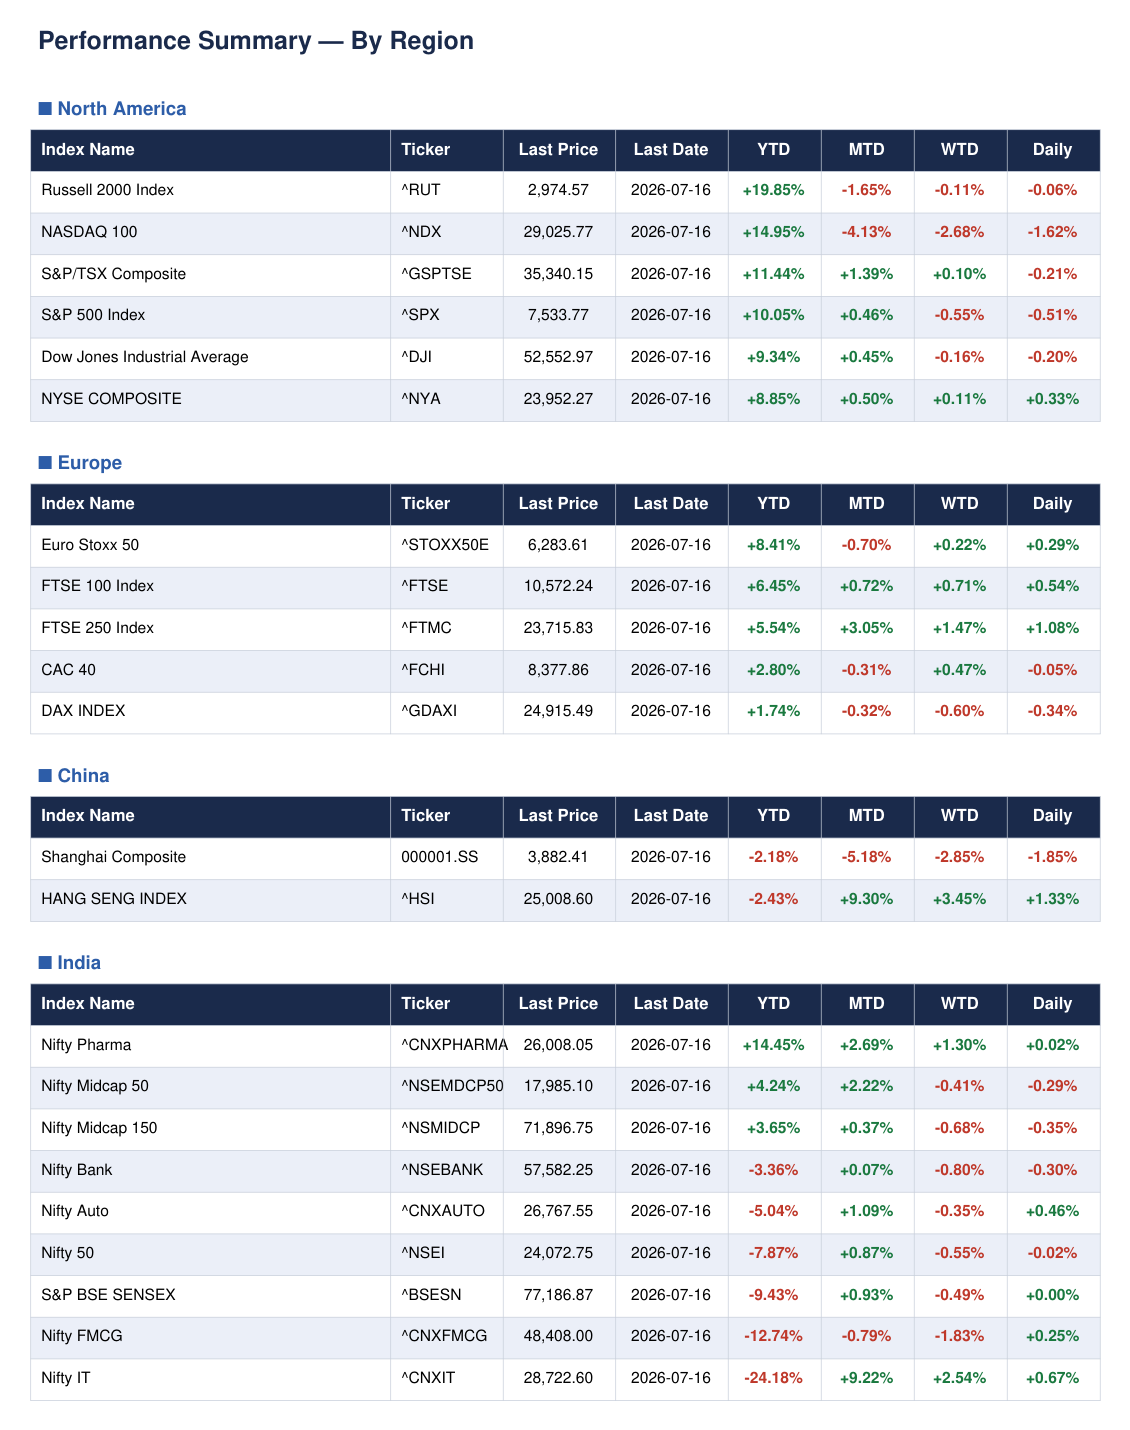
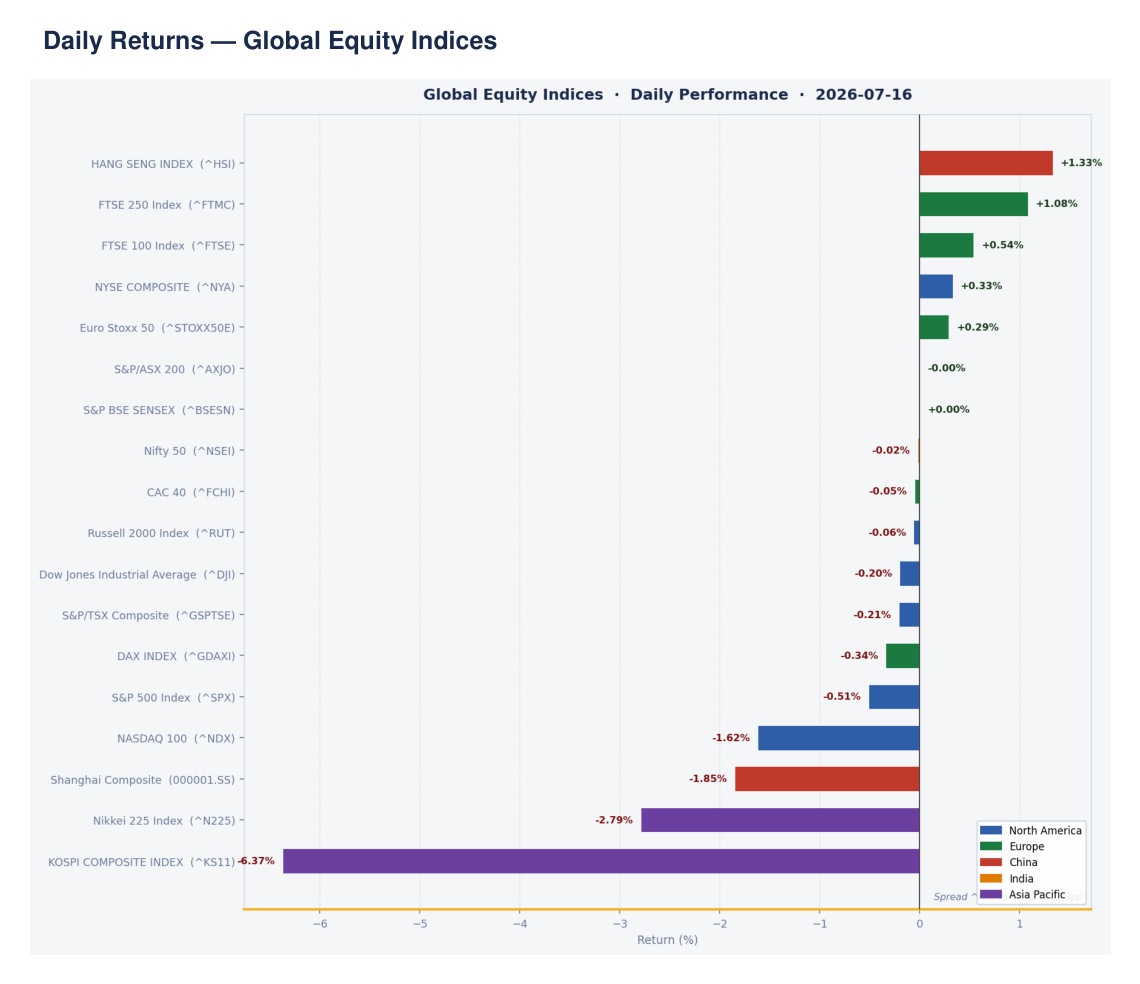
North America was mixed in direction but uniformly soft. The NYSE Composite was the lone bright spot at +0.33%, whilst the NASDAQ 100 bore the brunt at -1.62%. Europe outperformed convincingly — the FTSE 250 gained +1.08%, the FTSE 100 added +0.54%, and the Euro Stoxx 50 rose +0.29%. The DAX slipped -0.34%. In China, the Hang Seng continued its strong MTD run, adding +1.33%, whilst the Shanghai Composite fell -1.85%. India was broadly sideways — Nifty 50 down just -0.02%.
Asia Pacific + Market Sentiment + US Treasury Yields
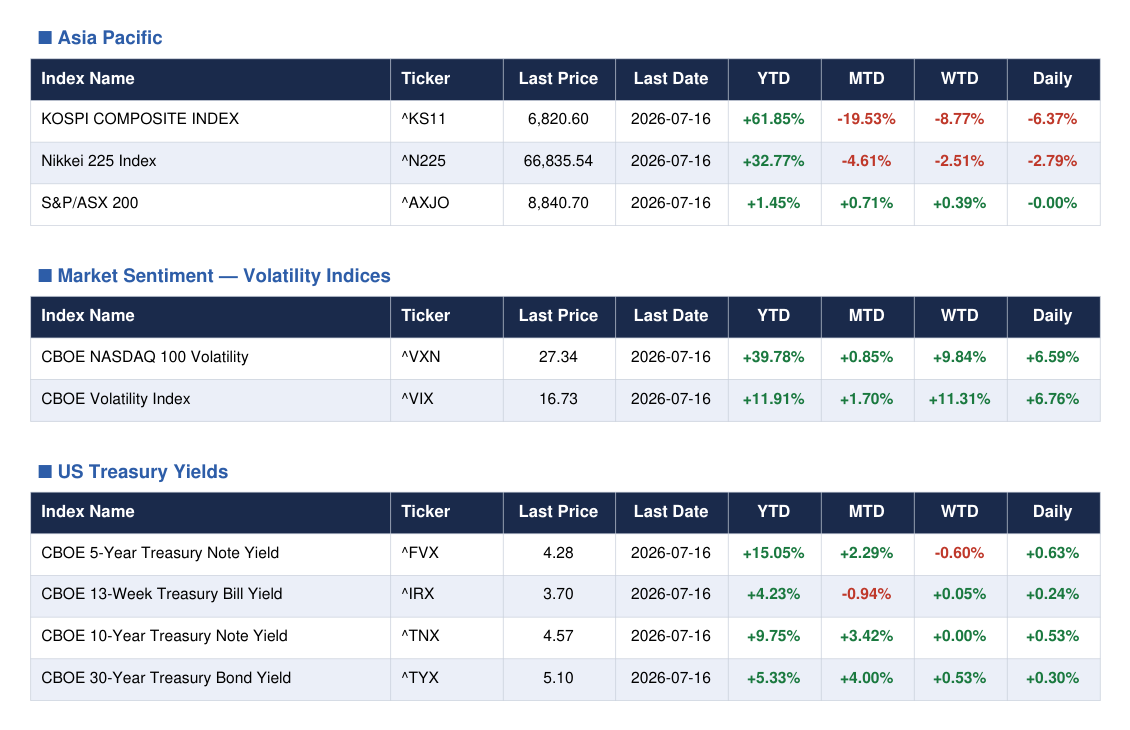
Asia Pacific was a tale of two markets. The Nikkei 225 dropped -2.79% and the KOSPI fell a sharp -6.37% — a significant move that warrants attention. The ASX 200 was flat (-0.00%). The VIX jumped +6.76% to 16.73, and the VXN surged +6.59% to 27.34. Volatility is moving in one direction. On the rate side, the 5-year yield rose +0.63% to 4.28% and the 10-year climbed +0.53% to 4.57% — yields are pushing higher even as equities fall.
Global Daily Bar Chart
The FTSE 250 was the best performing index globally on the day, gaining +1.08% — a sign that UK domestic mid-caps are finding buyers as global tech rolls over. At the other end, the KOSPI’s -6.37% collapse stands out as the single worst reading worldwide. When the world’s top YTD performer (up +61.85%) starts giving back gains at this pace, it signals the unwinding of a crowded trade. Yellow flag for Asia Pacific momentum.
Rates & Treasuries
Bond ETF Daily Returns
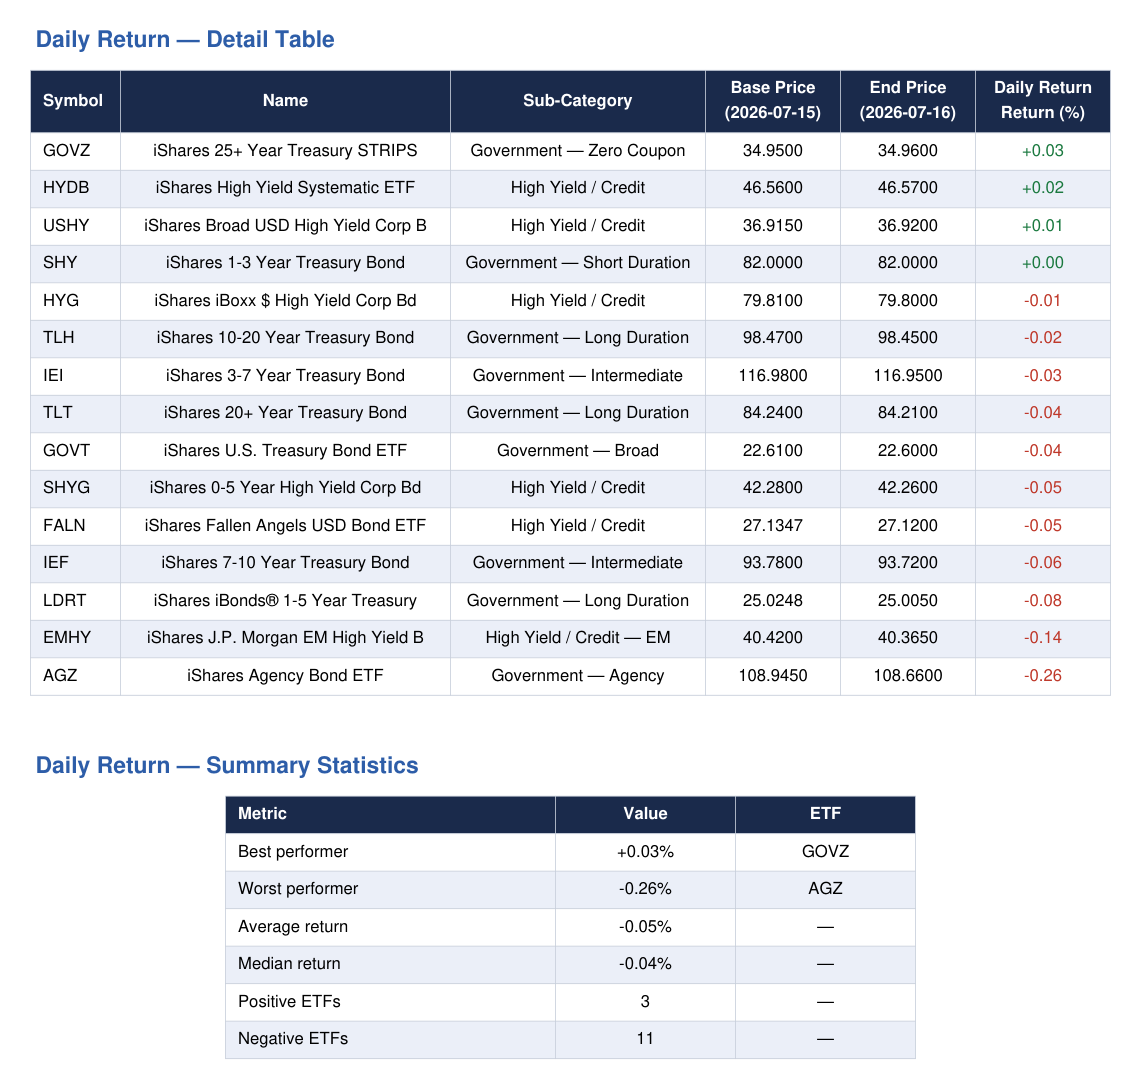
Only three ETFs finished in positive territory today. GOVZ (25+ year STRIPS) eked out +0.03%, HYDB gained +0.02%, and USHY added +0.01%. Everything else was red. IEF fell -0.06%, TLT slipped -0.04%, and the worst performer was AGZ (Agency Bond ETF) at -0.26%. Government bonds provided no safe-haven cushion. High yield was modestly better, with HYG essentially flat at -0.01%. Eleven of fifteen ETFs finished negative.
Returns Chart
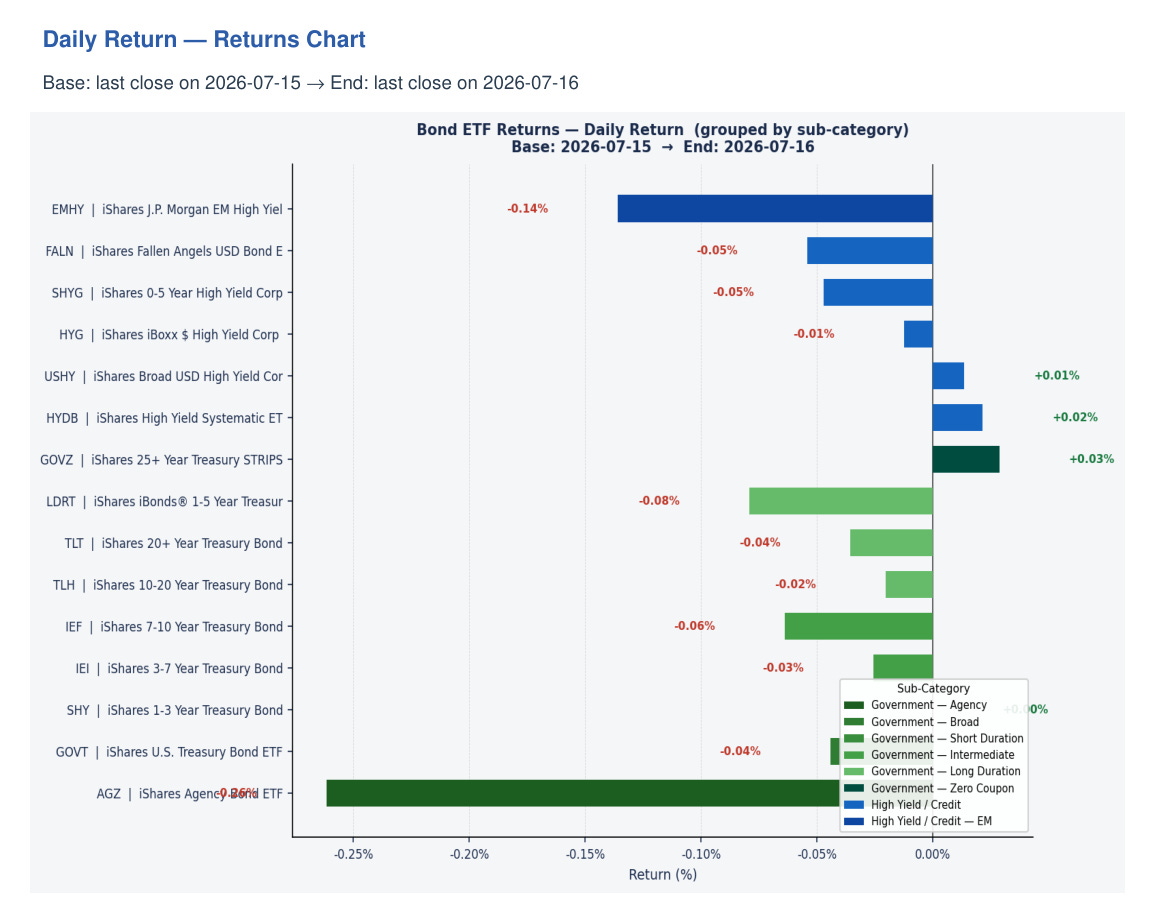
The bar chart tells a straightforward story: government bonds underperformed high yield across the duration spectrum today. The long end is being punished as yields tick higher — TLT and TLH both in the red. High yield credit (HYG, HYDB, USHY) held up considerably better, which is an interesting nuance. When high yield outperforms government bonds in a risk-off equity session, it suggests the sell pressure is rate-driven rather than credit-fear driven. Risk appetite signal: mixed.
Yield Curve
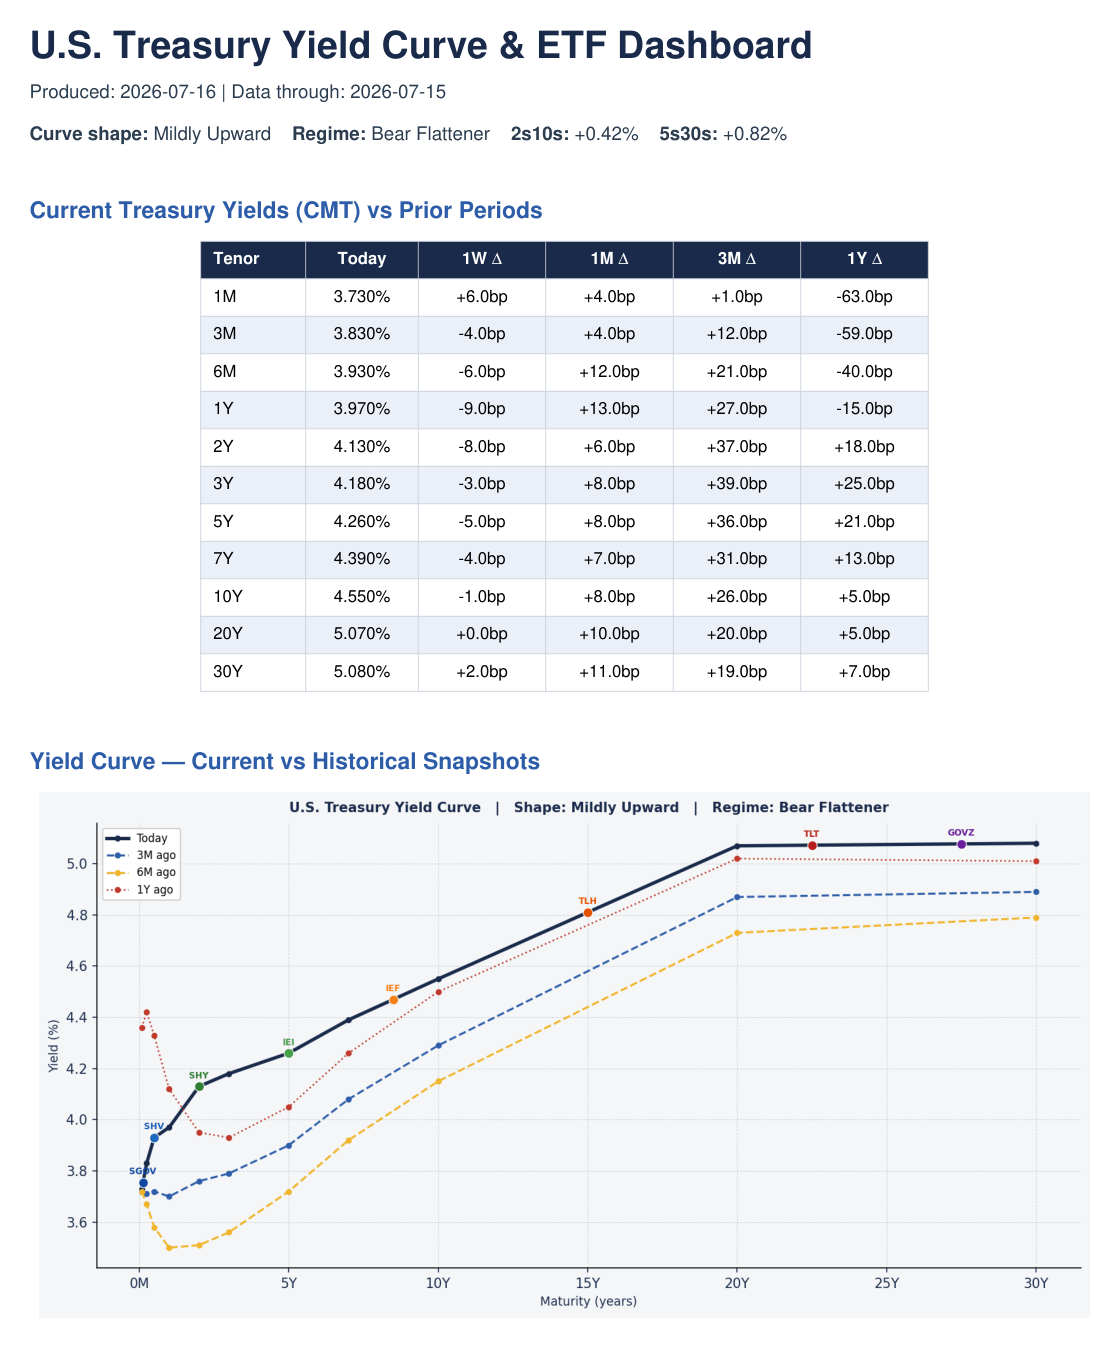
The regime is a Bear Flattener. The curve is mildly upward sloping with 2s10s at +0.42% and 5s30s at +0.82%. Key yields: 2Y at 4.13% (down 8bp over 1 week), 10Y at 4.55% (down 1bp over 1 week), 30Y at 5.08% (up 2bp over 1 week). The short end is rallying slightly on a weekly basis whilst the long end is creeping higher — classic Bear Flattener dynamics. The 30-year at 5.08% is a line in the sand for long-duration assets.
ETF Sectors
SPDR Sectors
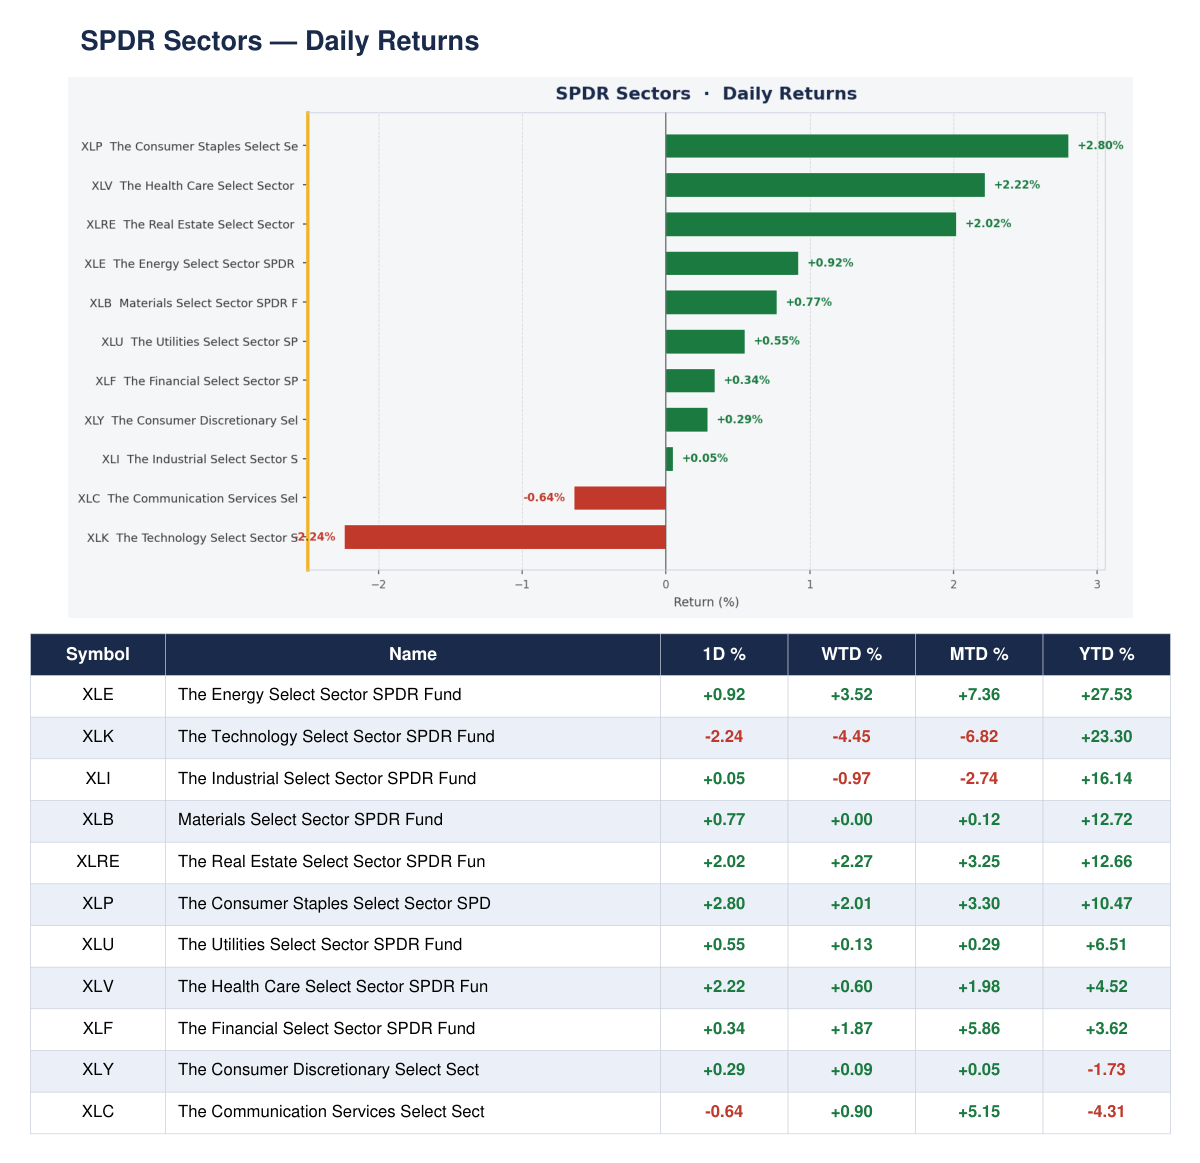
The defensive rotation is unmistakable. Consumer Staples (XLP) led all sectors at +2.80%, followed by Real Estate (XLRE, +2.02%) and Healthcare (XLV, +2.22%). Energy (XLE) added +0.92%. On the other side, Technology (XLK) was the clear laggard, down -2.24%, with Communication Services (XLC) also in the red at -0.64%. When staples, healthcare, and real estate lead and technology lags, the market is telling us investors are rotating out of growth and into defence.
Tech Thematic
Semiconductors were the epicentre of today’s pain. SOXX dropped -4.46% and SMH fell -3.70% — both ran hard into resistance after strong YTD runs. Cybersecurity also sold off, with CIBR down -1.29% and HACK falling -1.02%. IGV (software) slipped -0.26%. The one bright spot was WCLD (cloud computing), which gained +0.49% — the lone green flag in tech thematic today. Semis have now shed -17.21% MTD for SOXX. That is not a small number.
ARK Innovation
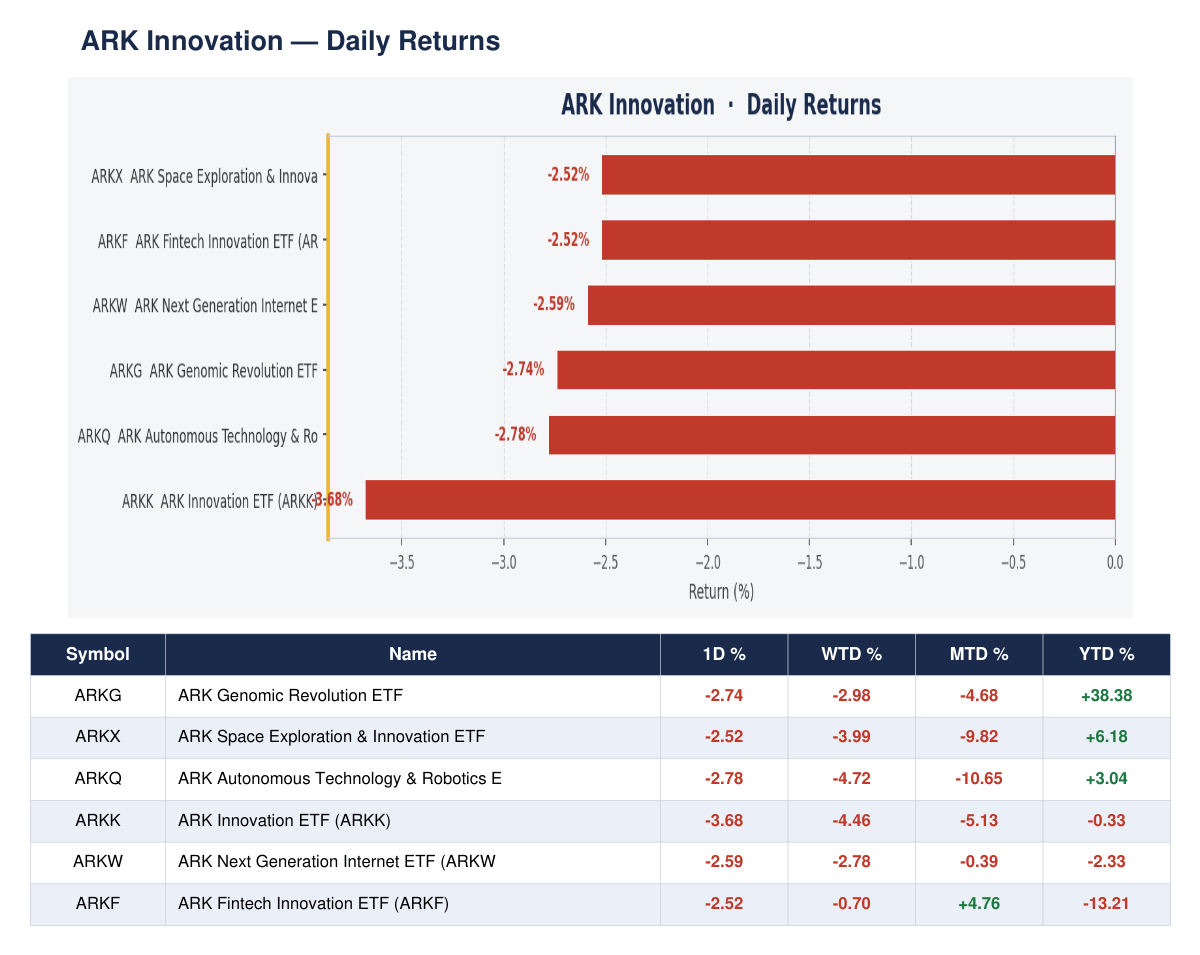
Every single ARK fund was in the red today. ARKK led losses at -3.68%, followed by ARKQ at -2.78% and ARKG at -2.74%. ARKW fell -2.59%, ARKF and ARKX both dropped -2.52%. ARKF is the relative survivor on a YTD basis at -13.21%, though that is cold comfort. The synchronised decline across all six ARK funds reinforces the risk-off read — speculative and innovation-heavy names are being sold without discrimination today.
Healthcare & Defence
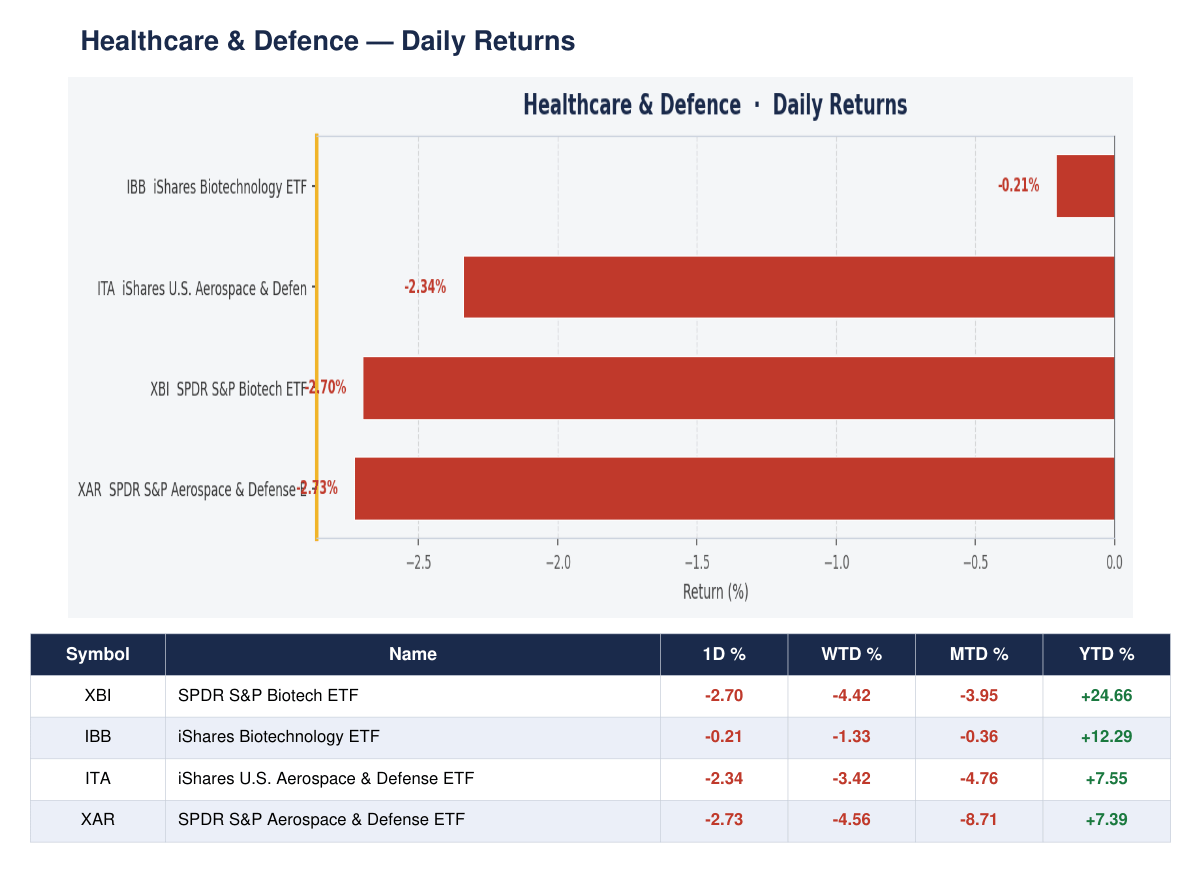
Both healthcare and defence came under pressure today, though the split matters. IBB (broad biotech) held up relatively well, down just -0.21%, whilst XBI (smaller-cap biotech) fell -2.70%. On the defence side, both ITA (-2.34%) and XAR (-2.73%) sold off meaningfully. Biotech is showing internal divergence — the large-cap names are holding whilst smaller biotechs get hit. Defence’s pullback is worth monitoring given its strong YTD base of +7.55% (ITA).
Consumer, Finance & Specialty
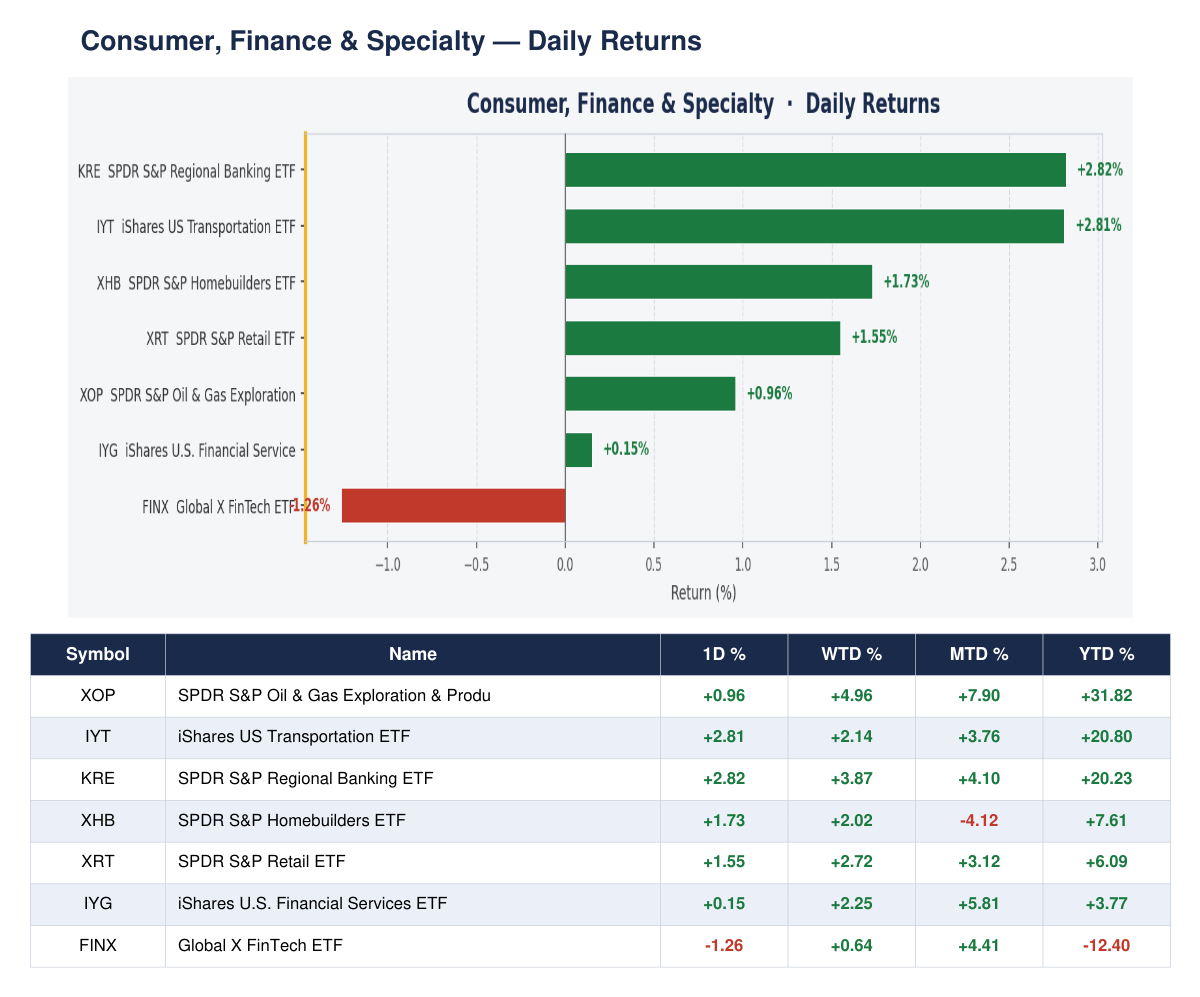
Regional banking (KRE) was the standout, surging +2.82% on the day — a strong showing that suggests confidence in the domestic credit environment. Transportation (IYT) added +2.81% and homebuilders (XHB) gained +1.73%. Retail (XRT) was up +1.55% and energy exploration (XOP) added +0.96%. The laggard was FinTech (FINX) at -1.26%. The breadth in this group is genuinely encouraging — consumer and finance names are holding up well even as large-cap tech collapses.
Stock Screener
S&P 500 Top 20
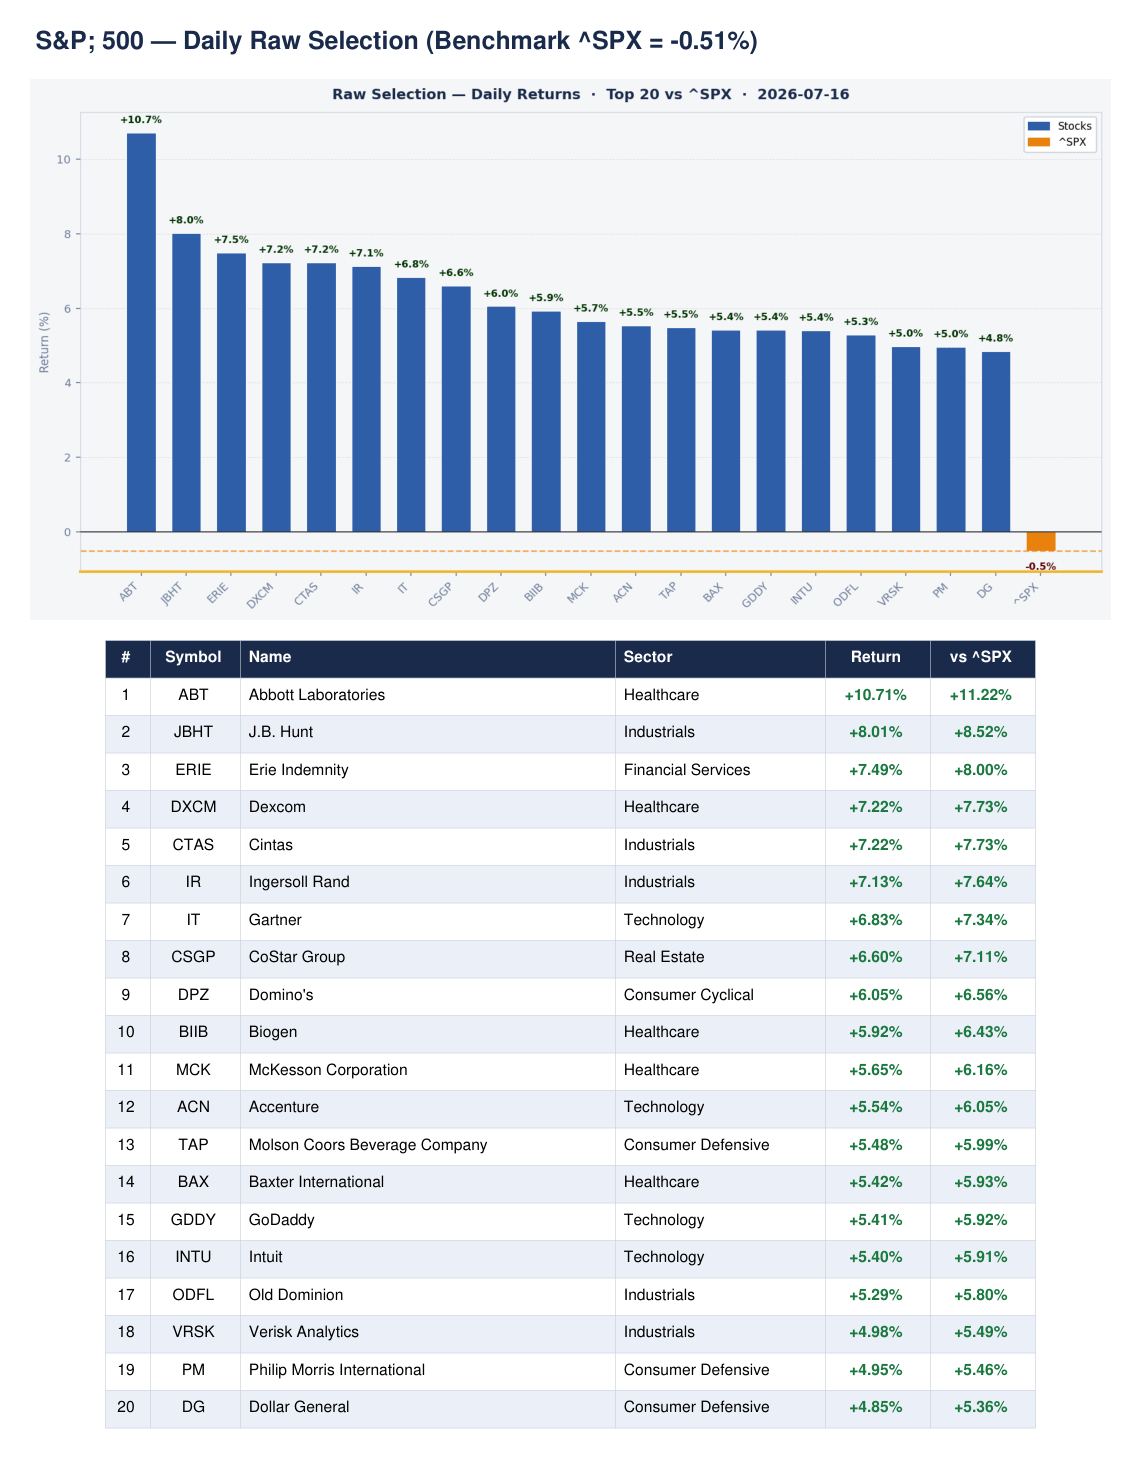
The S&P 500 fell -0.51% today, but our screener’s top-ranked names tell a very different story. Abbott Laboratories led the daily list with a +10.71% gain, followed by J.B. Hunt (+8.01%) and Erie Indemnity (+7.49%). Healthcare dominated the top of the daily list — ABT, DXCM, BIIB, MCK, and BAX all featured. Industrials were well-represented too with JBHT, CTAS, IR, ODFL, and VRSK. In the refined scored list, ODFL, PANW, VLO, PM, and JBHT all score 92/100 — the highest-quality setups on our watchlist right now.
Russell 2000 Top 20
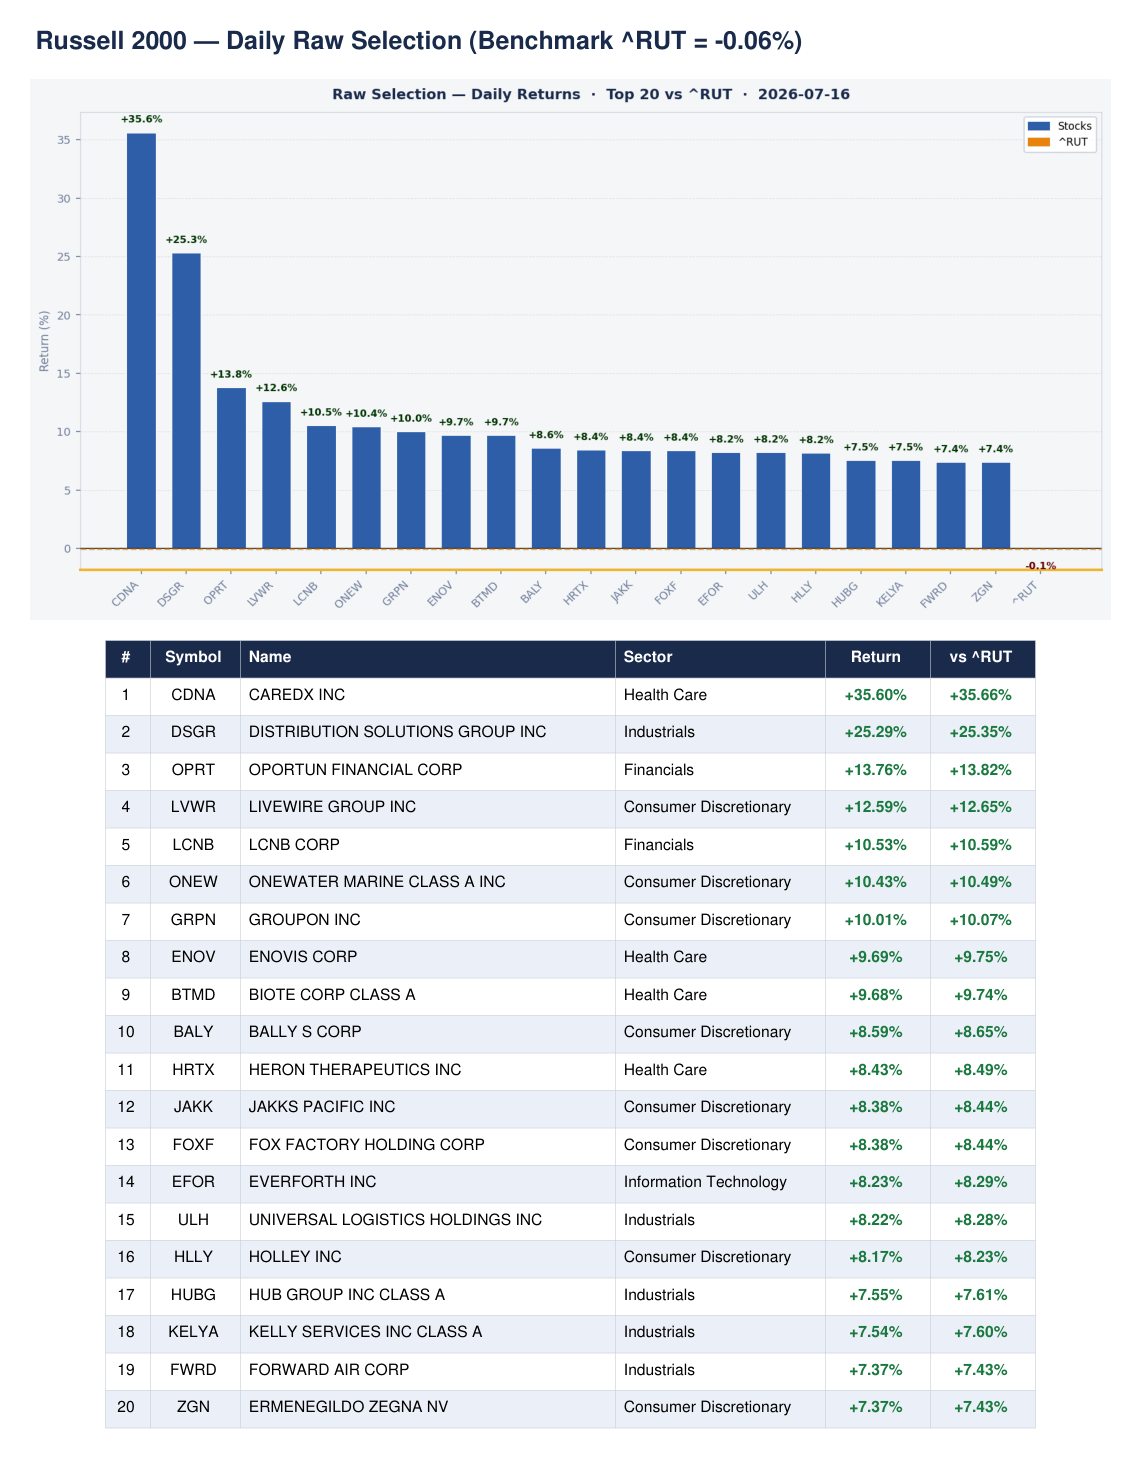
The Russell 2000 held nearly flat at -0.06%, and our top-ranked names in the small-cap universe showed real firepower. CareDx (CDNA) surged +35.60%, Distribution Solutions Group (DSGR) gained +25.29%, and Oportun Financial (OPRT) added +13.76%. Health Care and Consumer Discretionary dominated the daily list. In the refined scored names, MRVI, LCNB, ZGN, TCBK, JAKK, and BVS all score 92/100 — six names at the top of the range. Financials and Health Care are the dominant sectors across our small-cap watchlist.
52-Week New Highs
S&P 500
The S&P 500 produced 41 new 52-week highs today — a solid number given the broad market decline. Financial Services led the way with 13 names, followed by Industrials (8), Healthcare (4), Real Estate (4), and Energy (3). Notable names hitting new highs include Humana (HUM), UnitedHealth (UNH), State Street (STT), Best Buy (BBY), Invesco (IVZ), Airbnb (ABNB), CVS Health (CVS), and BNY Mellon (BNY). The breadth in financials is particularly noteworthy — 13 new highs in that sector signals genuine institutional accumulation.
Russell 2000
The Russell 2000 delivered an impressive 217 new 52-week highs — a number that stands in sharp contrast to the weakness visible in large-cap tech. Financials absolutely dominated with 128 names, followed by Health Care (25), Real Estate (22), Industrials (17), and Consumer Discretionary (7). Notable names include PESI, SEZL, ANGO, AGL, ETON, ELVN, PRVA, BSVN, ADPT, and TDOC. The sheer volume of small-cap new highs, concentrated in financials and healthcare, is a powerful internal breadth signal. Small caps are leading, not lagging.
FTSE 250
The FTSE 250 produced 12 new 52-week highs today, a respectable showing that aligns with the index’s +1.08% daily gain — its best performance among global indices. The list spans Financial Services (2), Industrials (2), Food Producers (1), and Consumer Cyclical (1), with six names in uncategorised sectors. Names hitting new highs include FCH.L, APN.L, HILS.L, EMG.L, ROR.L, MRC.L, 3IN.L, ASL.L, HSL.L, and RCP.L. UK mid-caps are quietly putting in a strong session whilst global attention focuses elsewhere.
FTSE 100
The FTSE 100 posted just 2 new 52-week highs today — MTLN.L (multiline utilities) and SDLF.L (life insurance). A thin number, but the index itself gained +0.54%, so the underlying bid is there even if breakouts are scarce. The two names hitting new highs are both defensive, income-oriented businesses — consistent with the broader defensive rotation we are seeing across global markets today. Quality over quantity here. The FTSE 100’s YTD gain of +6.45% continues to quietly compound.
Markets
SPX — S&P 500
NDX — Nasdaq 100
GC1! — Gold Futures
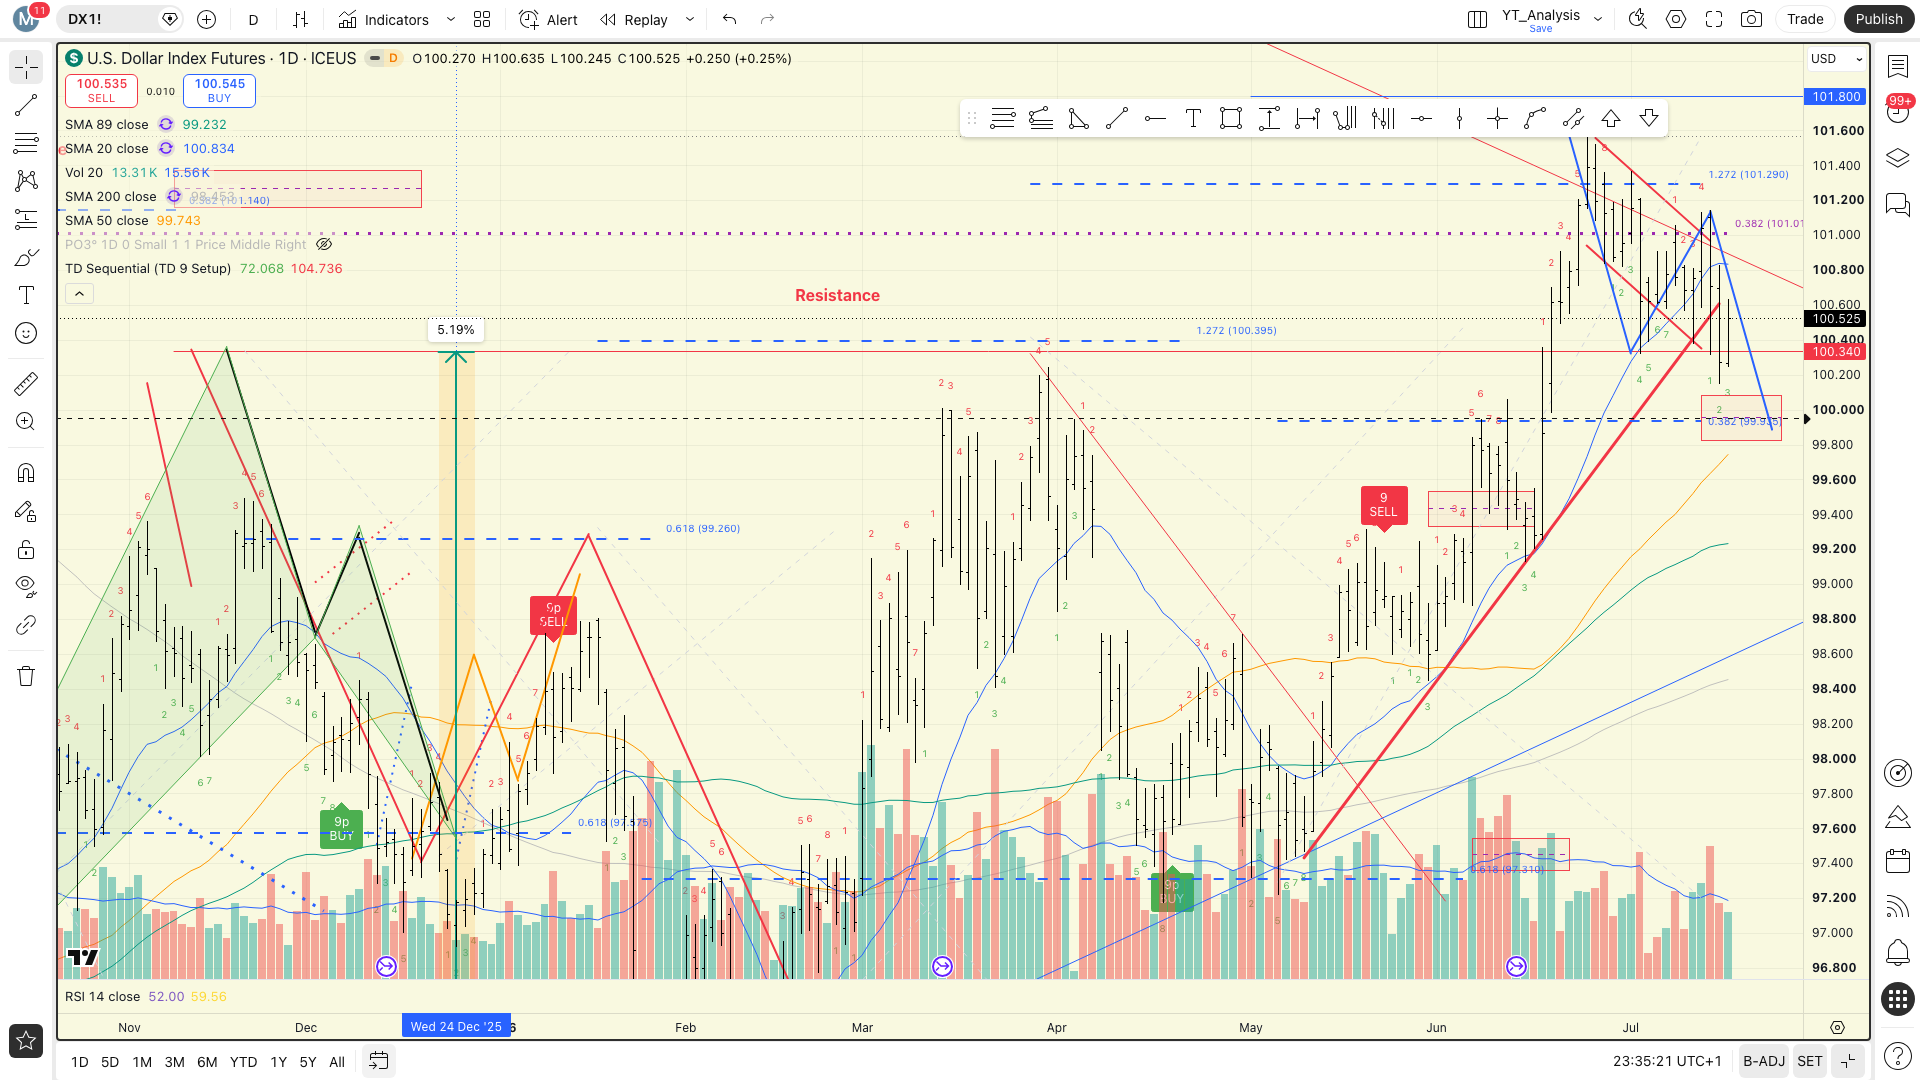
DX1! — US Dollar
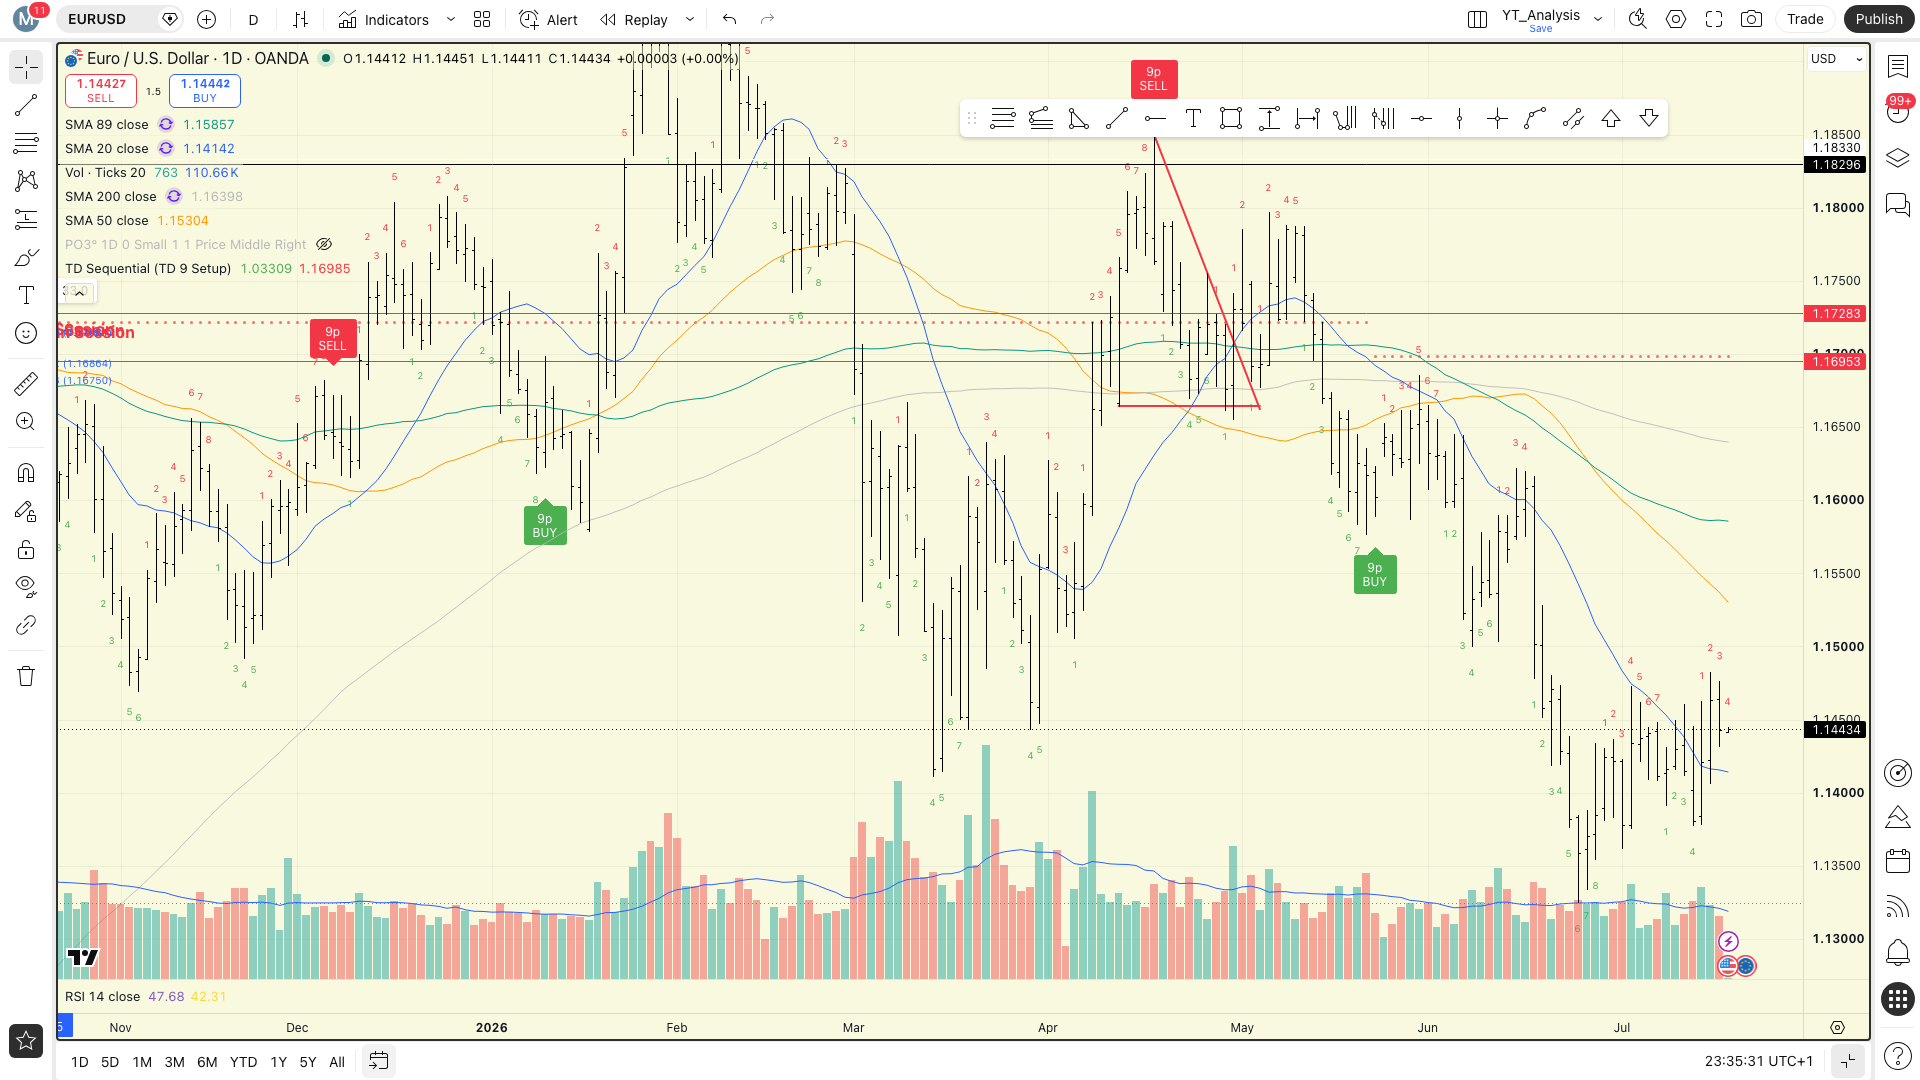
EURUSD — EUR/USD
BTCUSD — Bitcoin
Disclaimer
This publication is produced for educational and informational purposes only. Nothing in this article, including the written commentary, charts, images, data, and any internal or external links, constitutes financial advice, investment advice, trading advice, or any other form of professional financial guidance.
The content reflects the author’s analysis of publicly available market data and is shared solely to inform and educate. Past performance is not indicative of future results. Markets can and do move against any position or analysis presented here.
You should always conduct your own independent research and consult a qualified financial adviser before making any investment decisions. The author and publisher accept no liability whatsoeve