Markets Daily 07 July 2026: Tech Sells Off Hard, Energy Leads the Charge and Bonds Extend Their Slide

Summary
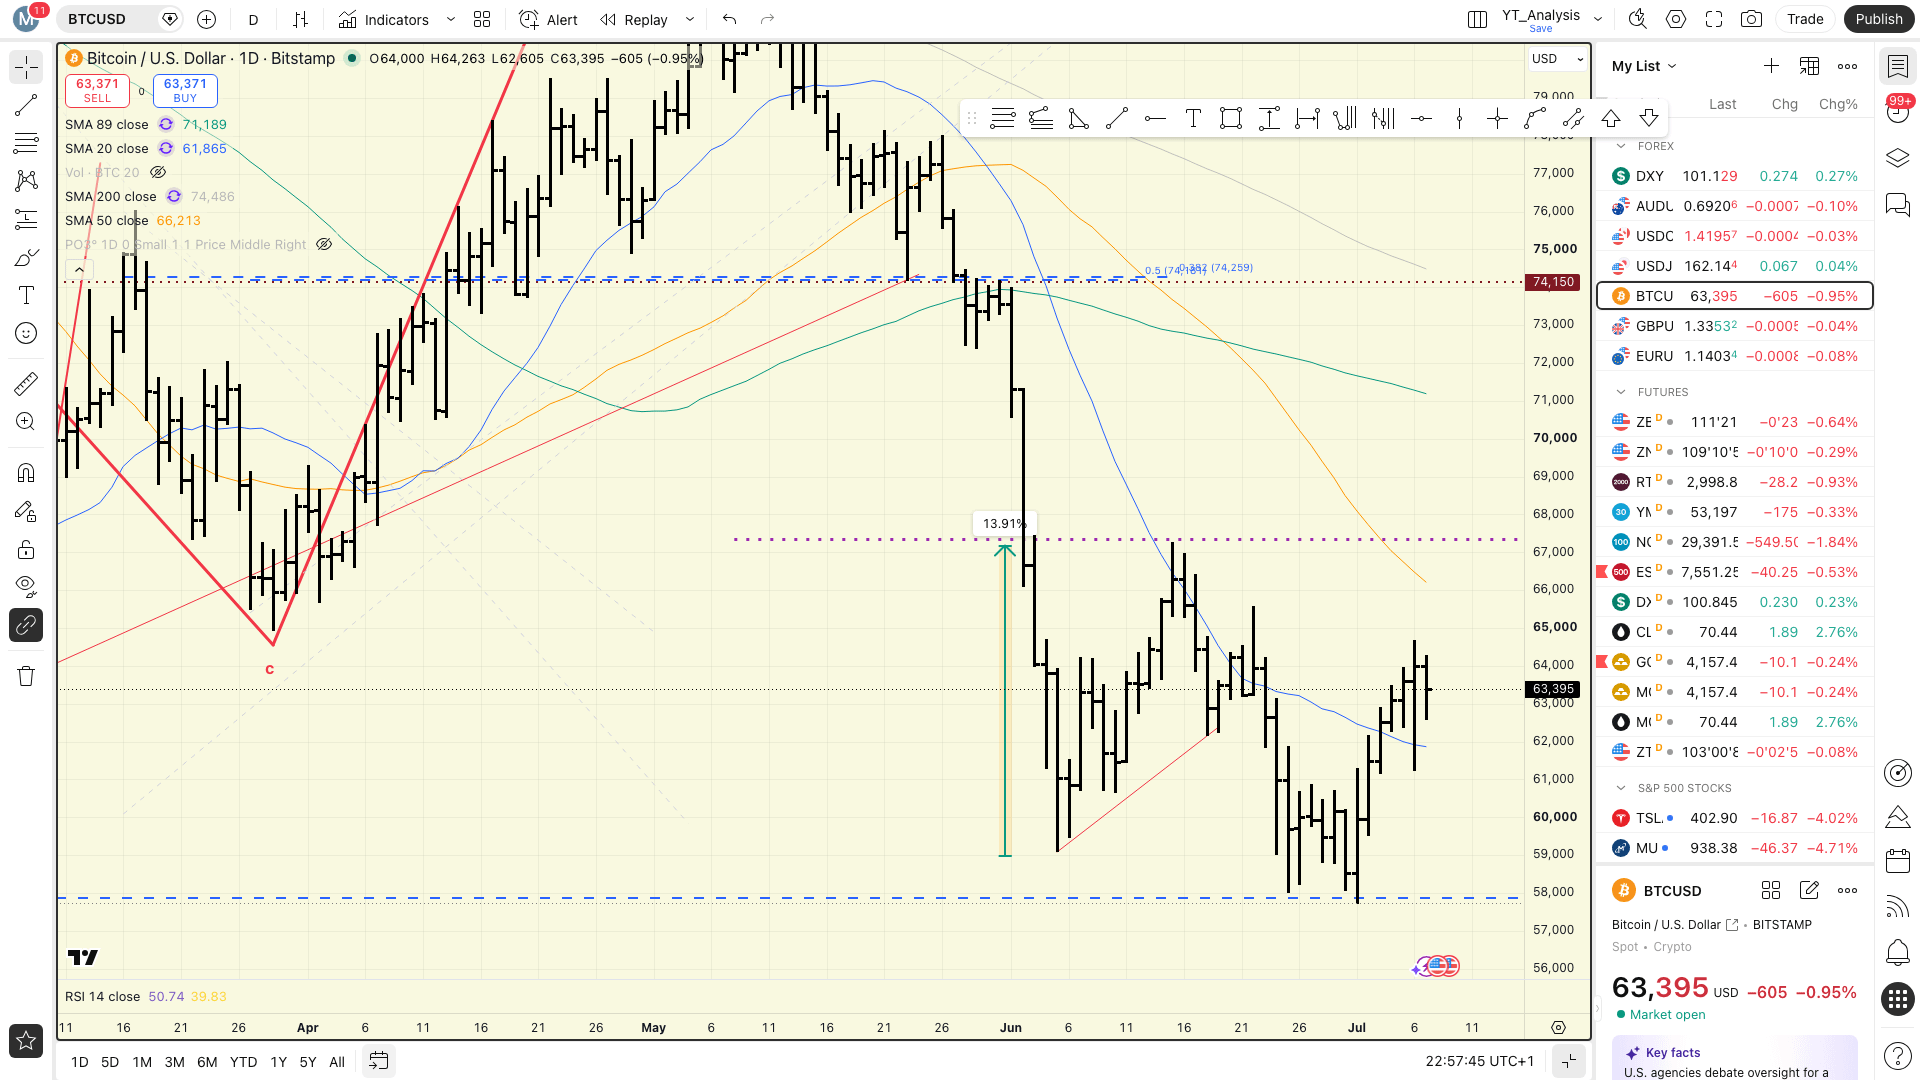
Bitcoin (IBIT) — flat +0.08%; only asset to close in the green, a defensive read on risk appetite
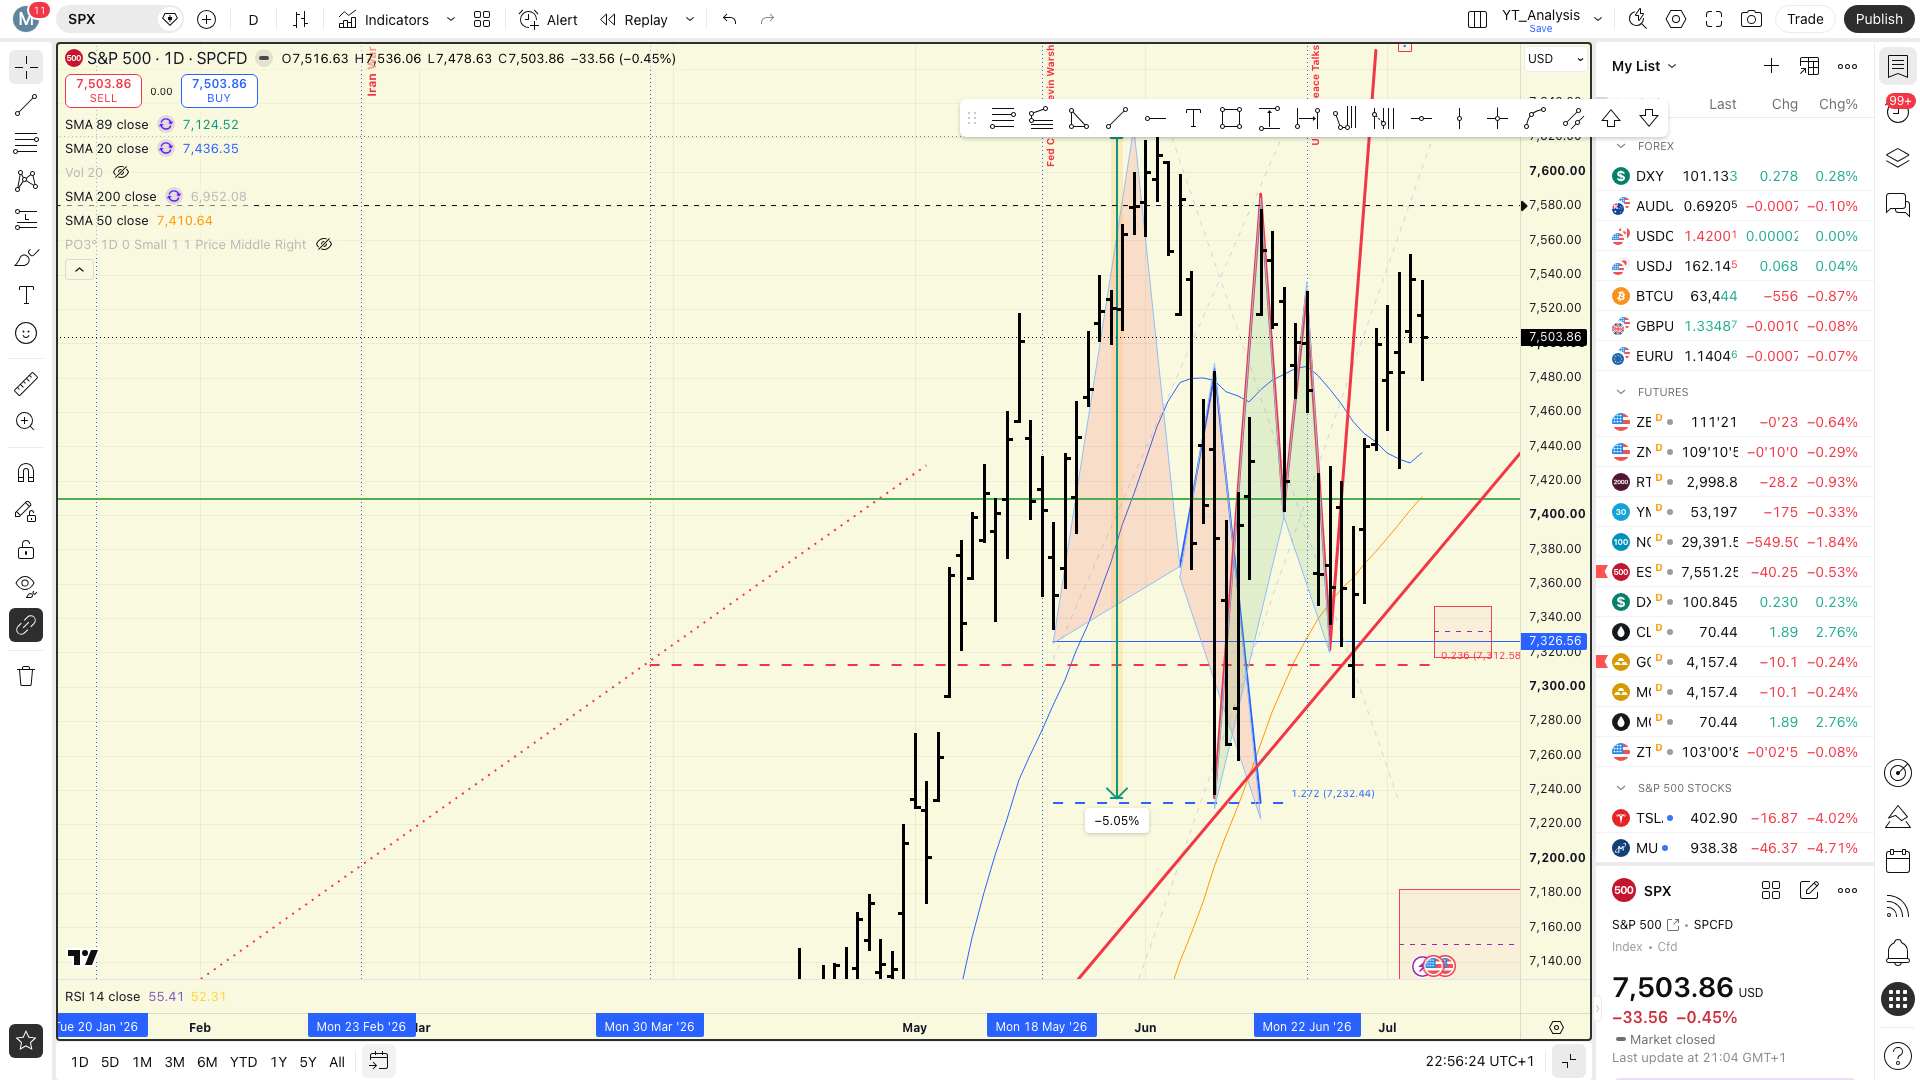
S&P 500 (SPX) — down -0.45% to 7,503.85; held relatively well against broader damage
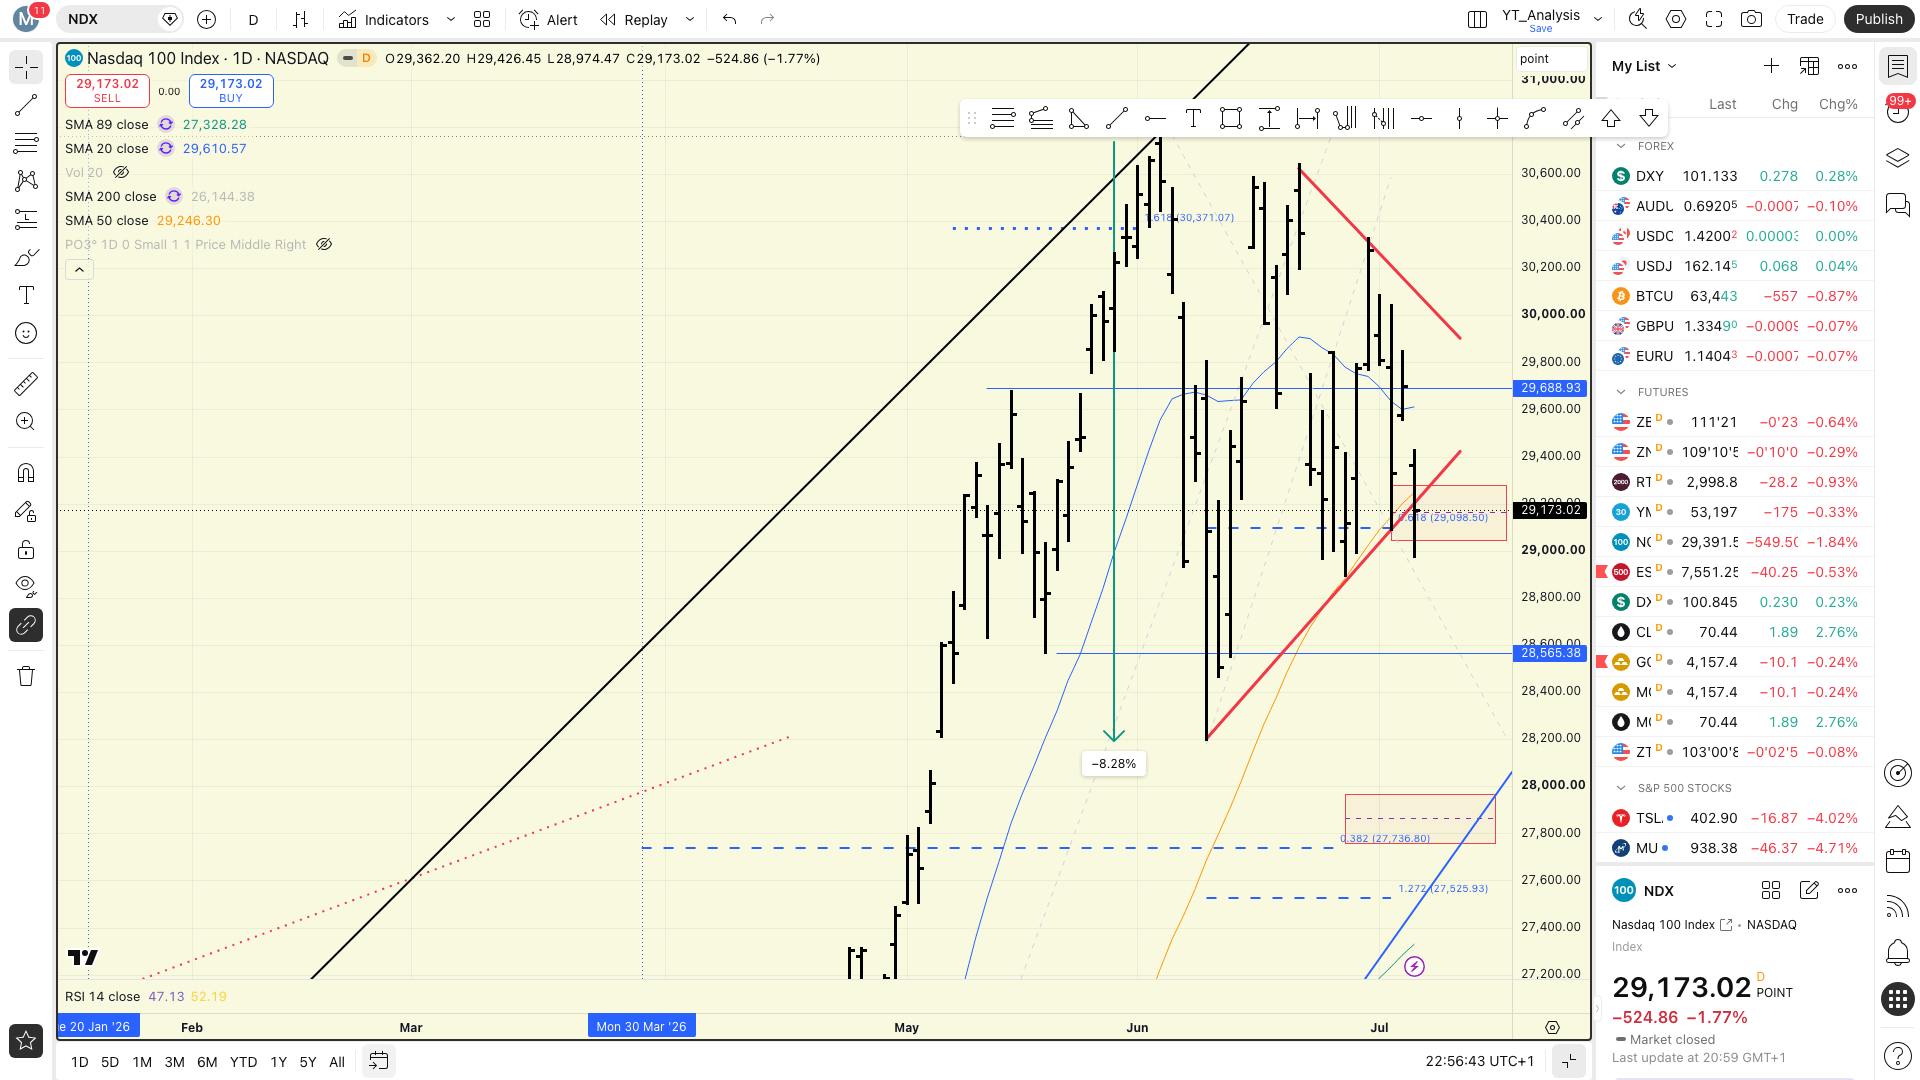
NASDAQ 100 (NDX) — fell -1.77%; tech bore the brunt of the session’s selling pressure
Russell 2000 (RUT) — dropped -0.90% to 2,982.49; small caps underperformed large caps
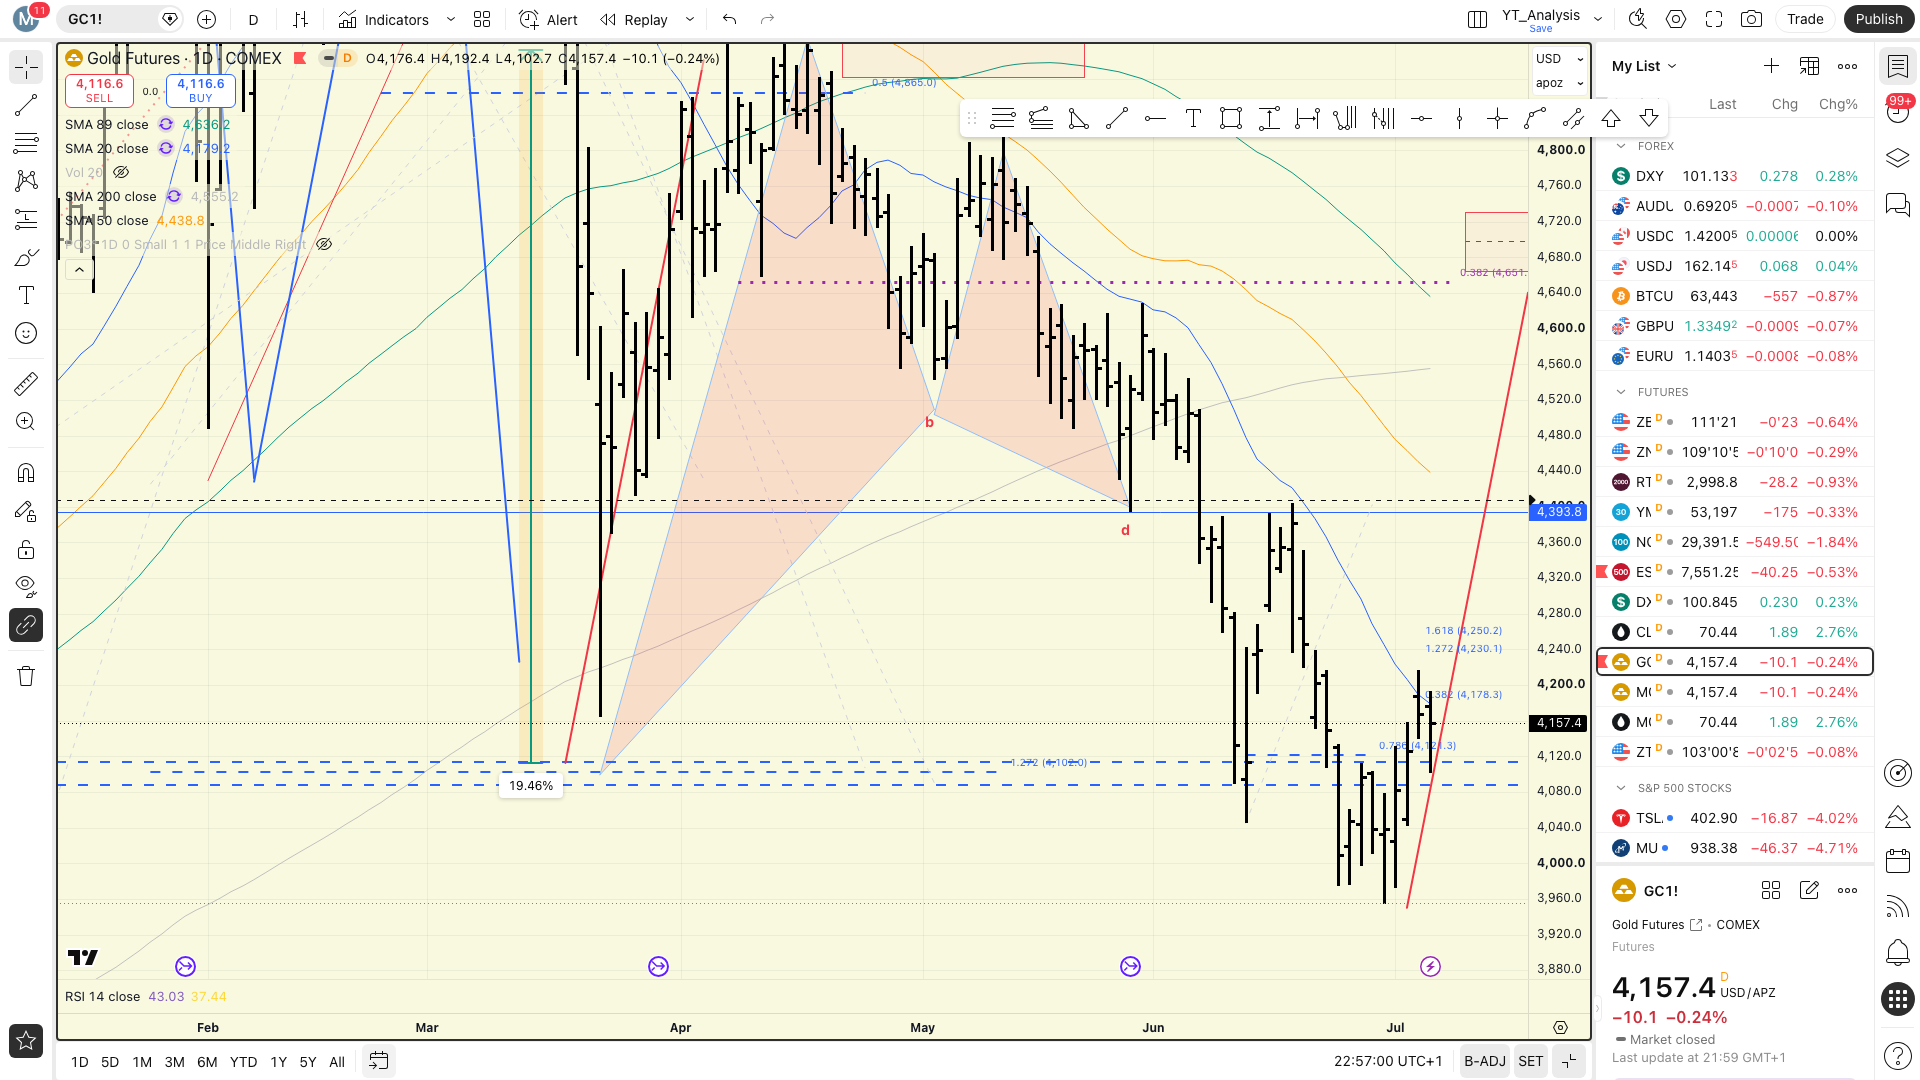
Gold (GLD) — down -1.21%; no safe-haven bid today, pressure across commodities
Silver (SLV) — worst equity-adjacent asset, sliding -2.94%
US Treasuries (GOVT) — fell -0.40%; bonds offered no shelter as yields pushed higher
Energy (XLE) — best SPDR sector on the day, +2.84%; clear rotation into value and defensives
Semiconductors (SOXX) — cratered -5.13%; single largest drag within tech thematics
Asset Classes
Cross-Asset Daily Returns
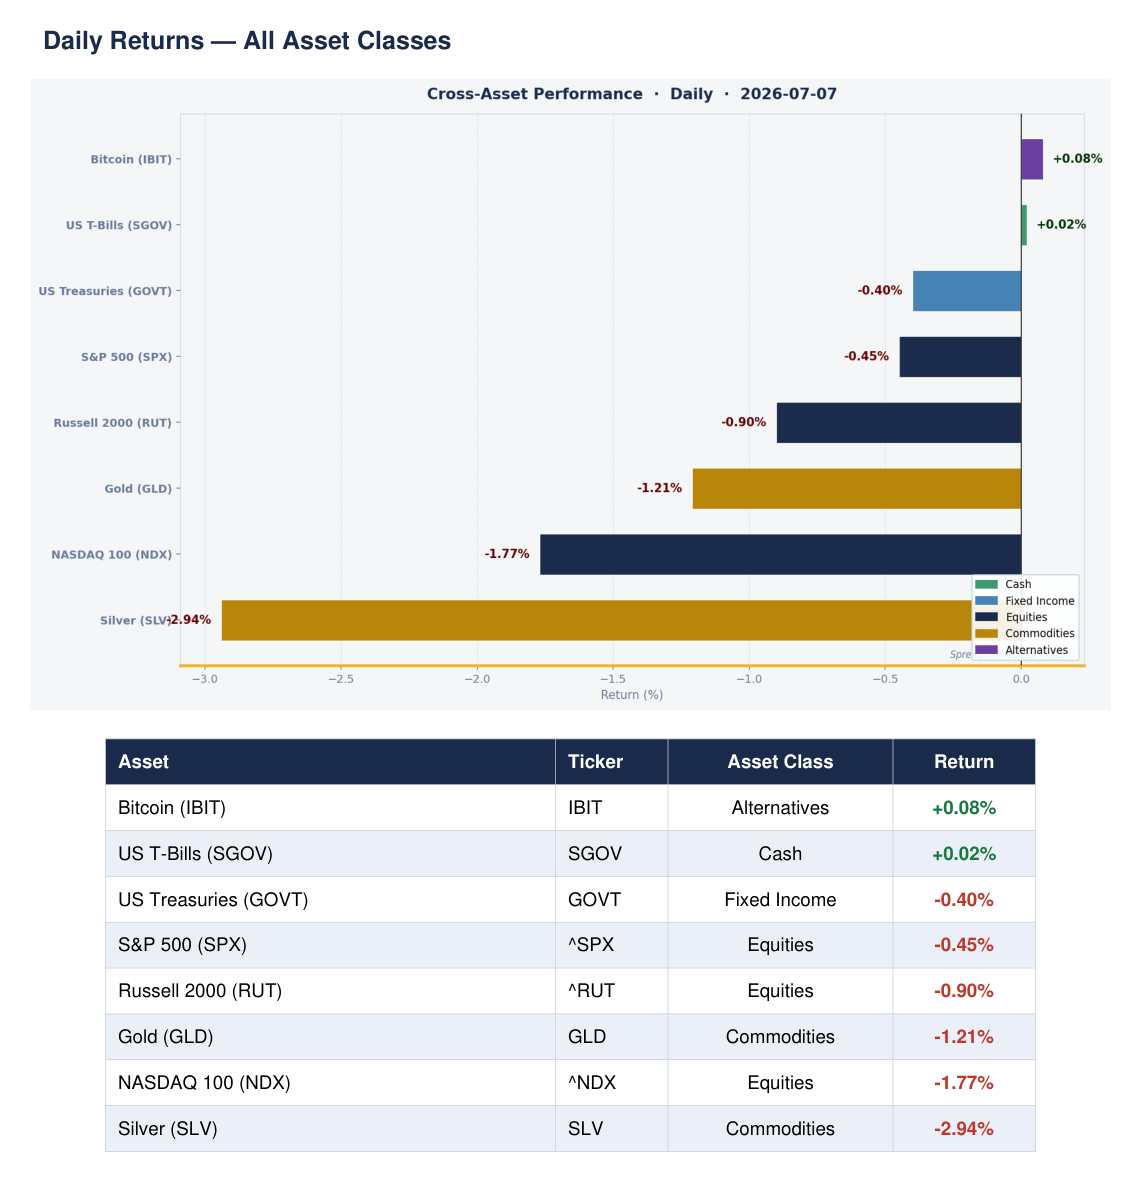
Here is the breakdown. Only two assets closed in positive territory on Tuesday: Bitcoin (+0.08%) and cash via SGOV (+0.02%). Everything else lost ground. Treasuries fell -0.40%, the S&P 500 dropped -0.45%, the Russell 2000 slid -0.90%, Gold gave back -1.21%, the NASDAQ 100 shed -1.77%, and Silver was the session’s biggest loser at -2.94%. This is an unambiguous risk-off session. When cash and Bitcoin top the leaderboard and every other asset class declines, the message is clear — sellers were in control.
Performance by Asset Class
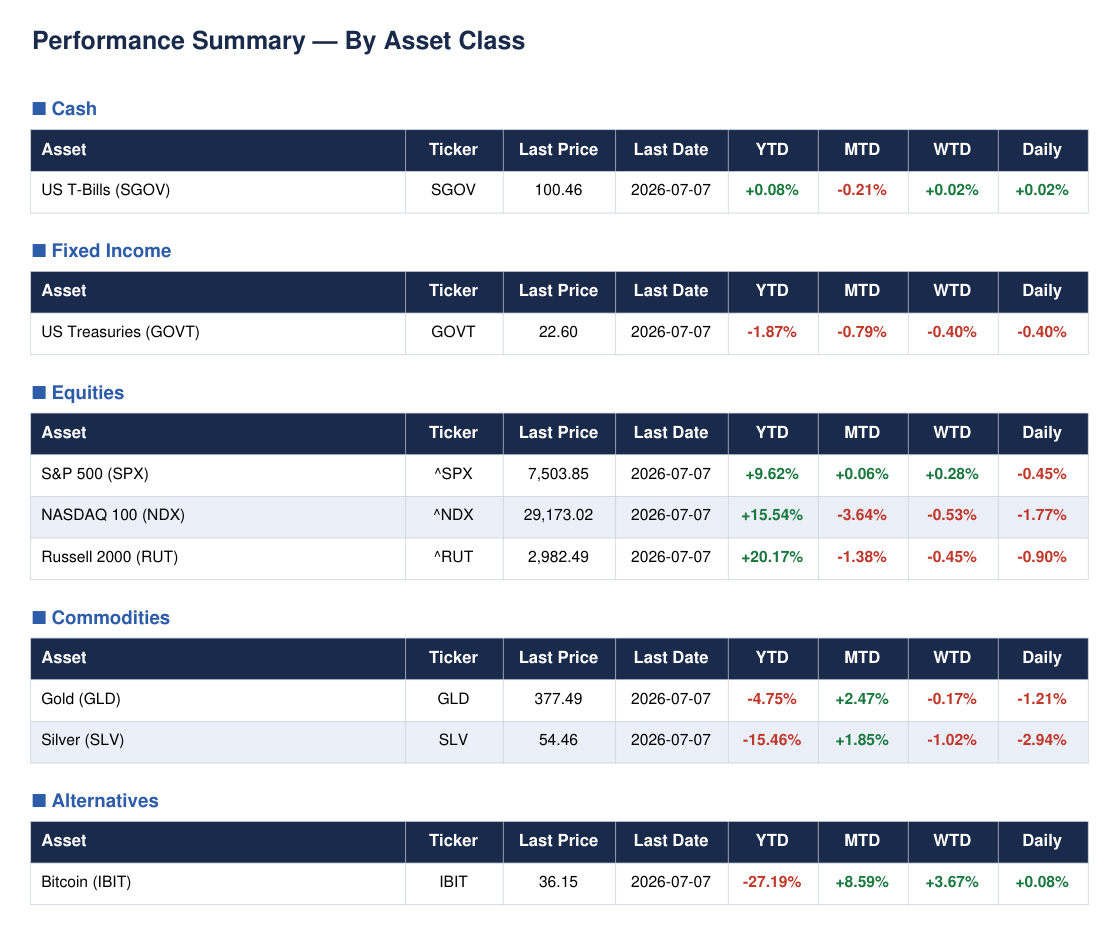
Cash (+0.02%) was the only asset class to meaningfully hold its ground. Fixed income fell -0.40%, dragged lower by rising yields across the curve. Equities were broadly weak — the NASDAQ -1.77%, Russell -0.90%, S&P -0.45% — with growth hardest hit. Commodities had a rough session: Gold -1.21%, Silver -2.94%, suggesting no inflation hedge buying either. Alternatives, proxied by Bitcoin, eked out +0.08% — positive but hardly a flight-to-quality signal.
World Indices
Performance by Region
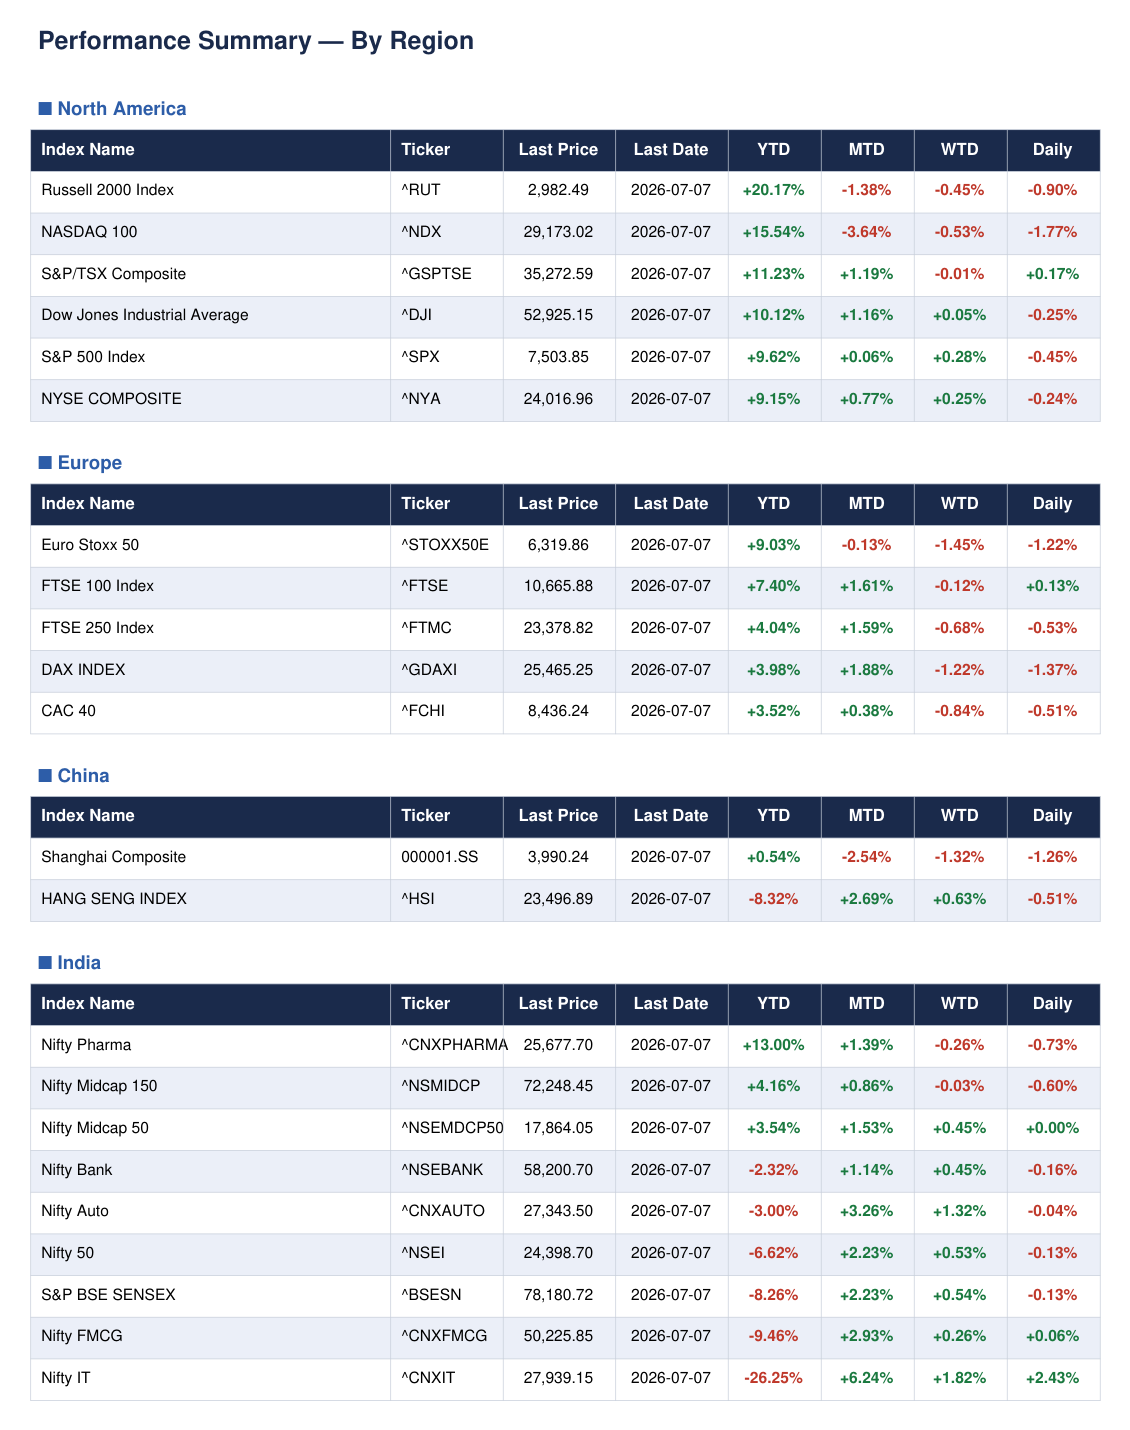
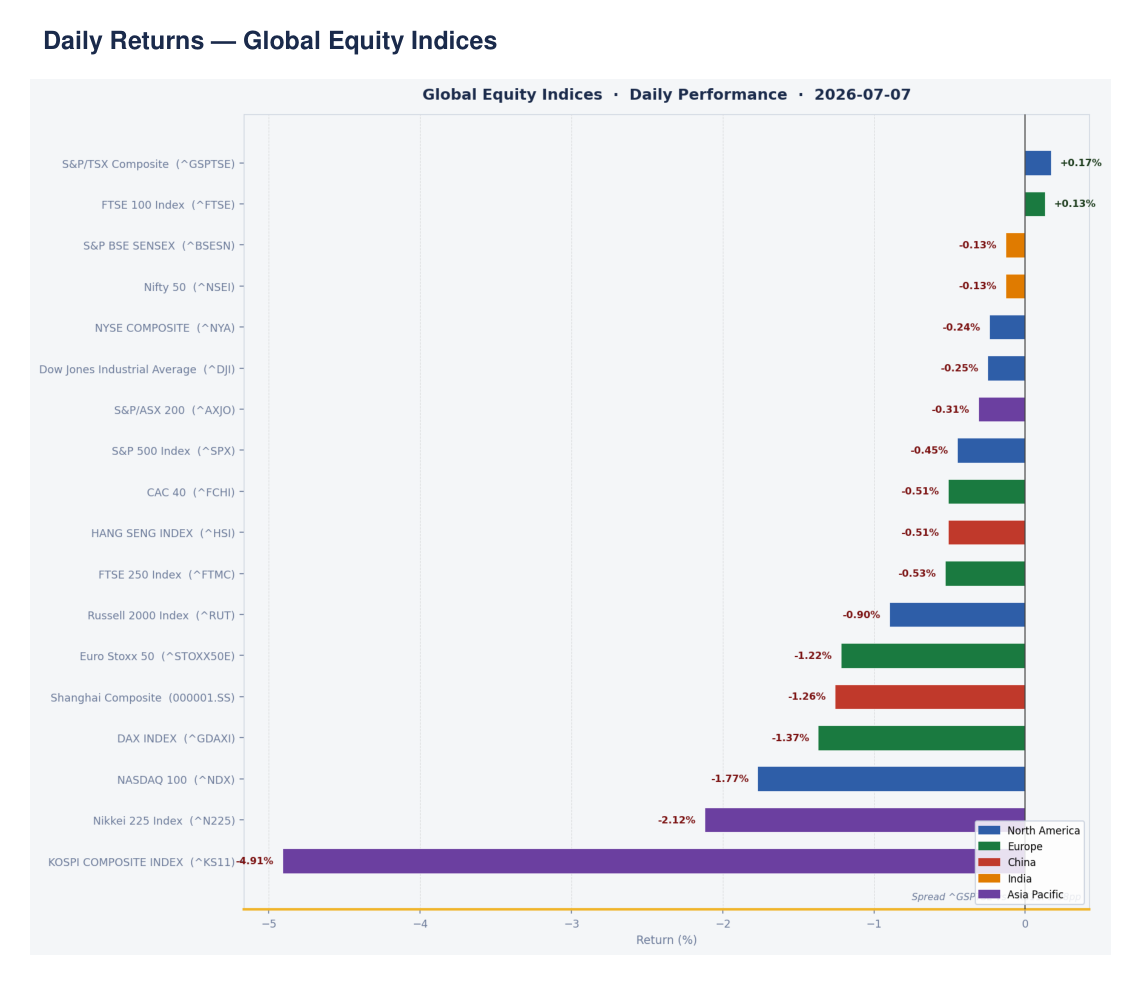
North America diverged sharply at the index level. The Canadian TSX held up best at +0.17%, the Dow shed just -0.25%, whilst the NASDAQ -1.77% and Russell -0.90% lagged badly. Europe was broadly lower — Euro Stoxx 50 -1.22%, DAX -1.37%, with only the FTSE 100 managing a small gain of +0.13%. China’s Shanghai Composite fell -1.26%, Hang Seng -0.51%. India was largely flat to marginally negative across most indices, with the notable exception of Nifty IT which gained +2.43% — an outlier worth monitoring.
Asia Pacific, Volatility and US Treasury Yields
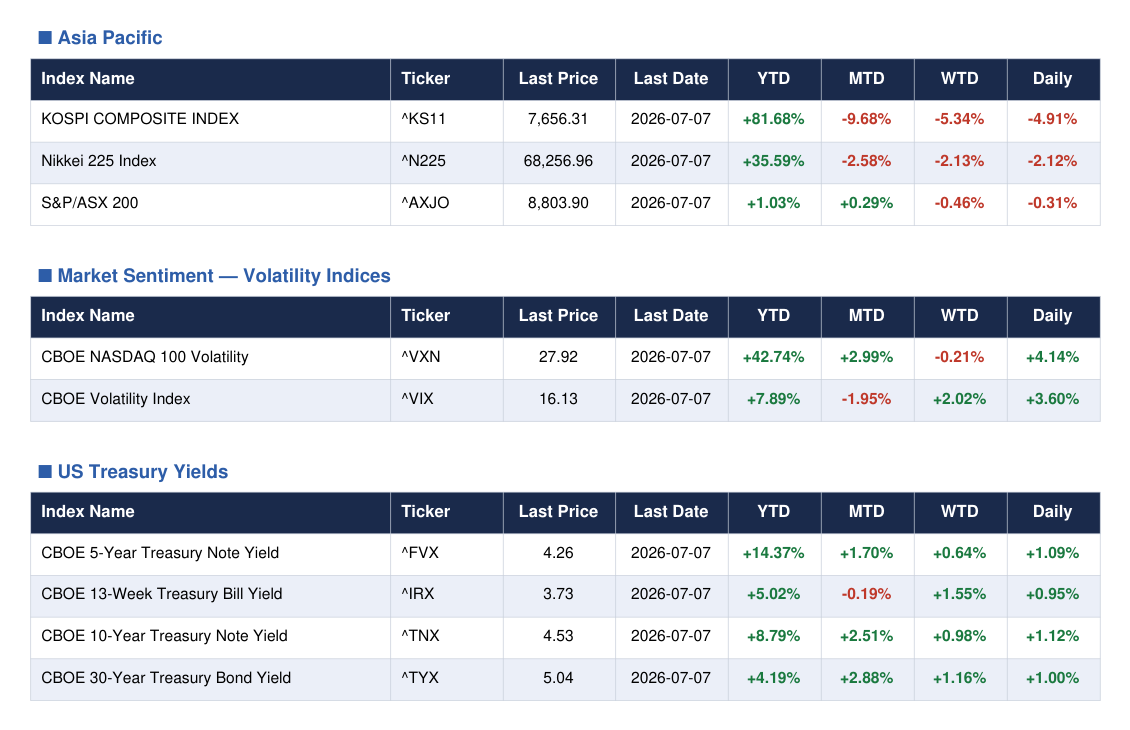
Asia Pacific was the weakest region globally. KOSPI led declines at -4.91%, Nikkei 225 fell -2.12%, ASX 200 gave back -0.31%. What jumps out immediately is the VIX — up +3.60% on the day to 16.13, and the VXN rising +4.14% to 27.92. Neither is at crisis levels, but both moving higher together is a yellow flag, not a red flag. US Treasury yields climbed across the board: the 10-year yield rose +1.12% on the day to 4.53%, the 5-year gained +1.09% to 4.26%, and the 30-year added +1.00% to reach 5.04%.
Global Daily Bar Chart
The single worst-performing index on the day was the KOSPI at -4.91% — a significant drawdown that signals continued stress in Korean equities, likely amplified by tech and semiconductor exposure. At the other end, Nifty IT’s +2.43% gain stood alone as a constructive outlier, driven by sector-specific tailwinds. The broad global picture remains risk-off, with selling distributed across Asia Pacific and Europe, whilst North America showed some resilience at the large-cap defensive end.
Rates & Treasuries
Bond ETF Daily Returns
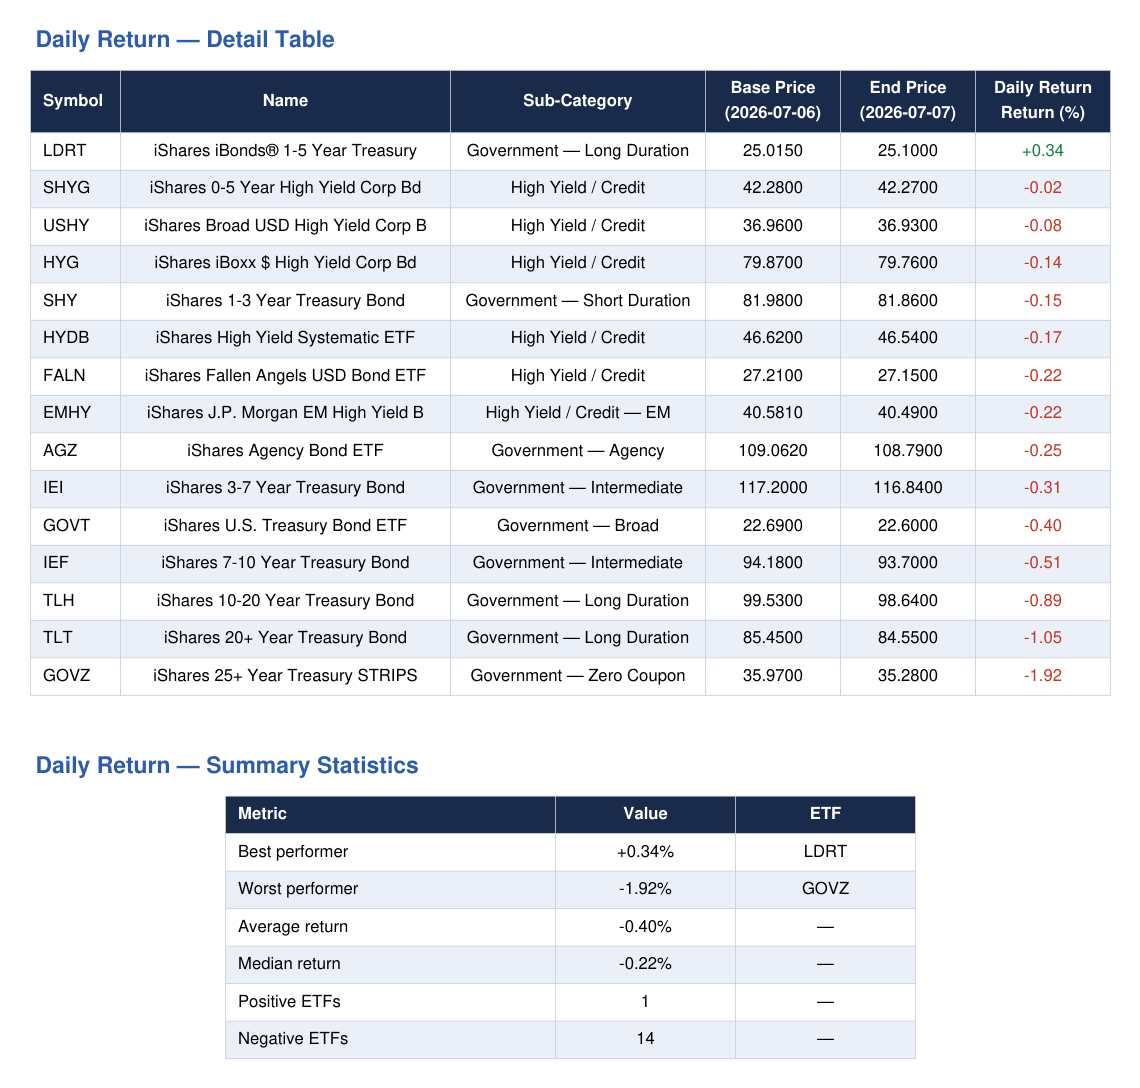
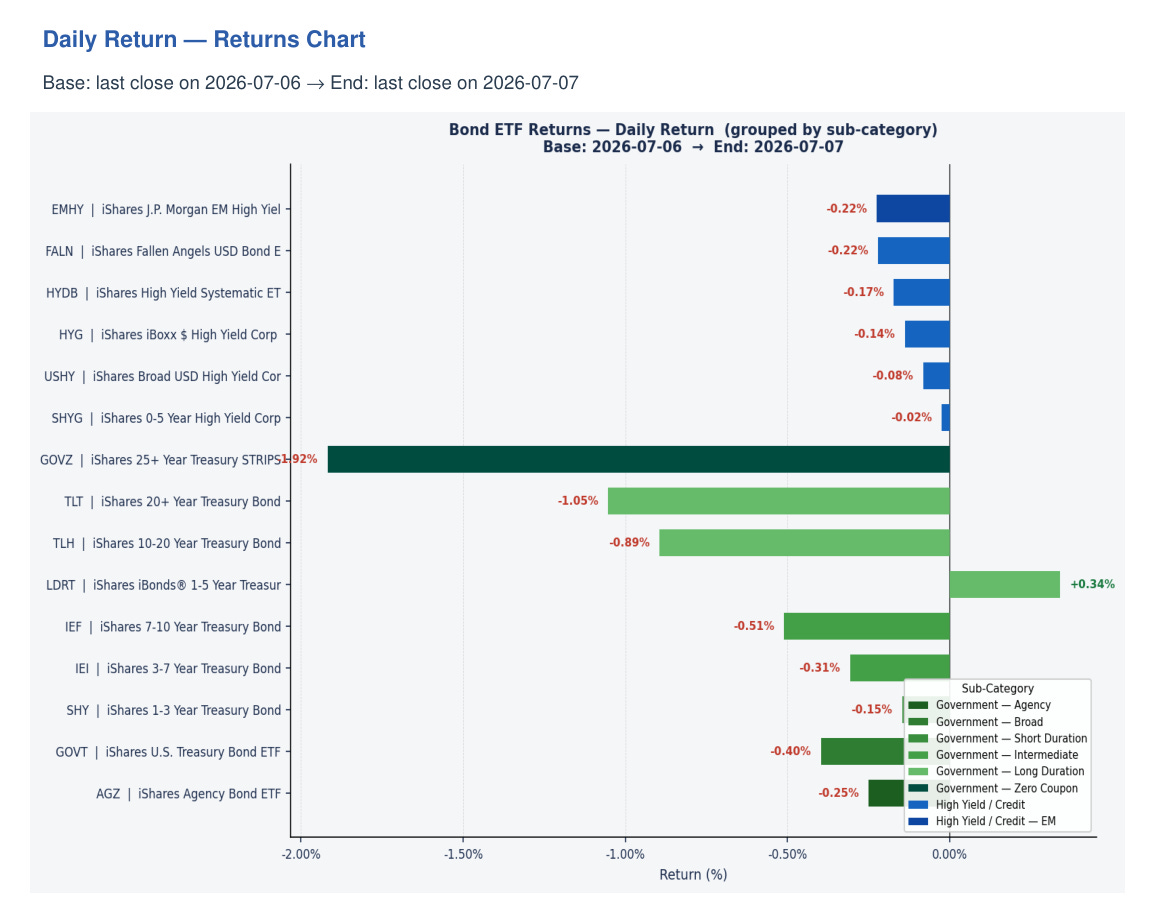
Only one ETF closed positive on Tuesday: LDRT (+0.34%), the short-duration iBonds 1–5 year Treasury product. Every other name in our coverage universe fell. Government bonds took the heavier losses — GOVZ -1.92%, TLT -1.05%, TLH -0.89%, IEF -0.51%. High yield held up better by comparison: HYG -0.14%, SHYG -0.02%, USHY -0.08%. The relative resilience of high yield versus government bonds is an interesting split — credit spreads are not blowing out even as rates rise.
Returns Chart — Risk Appetite Signal
The bar chart tells a clear story: duration is your enemy in this regime. Government bonds across all maturities declined, with losses scaling directly with duration. High yield credit held near flat. This is not a flight-to-quality move — it is a rates-driven sell-off. When government bonds fall whilst high yield outperforms, the signal is that the market is pricing higher-for-longer rates rather than a credit or growth scare. Worth watching whether this spread dynamic persists into the week.
Yield Curve
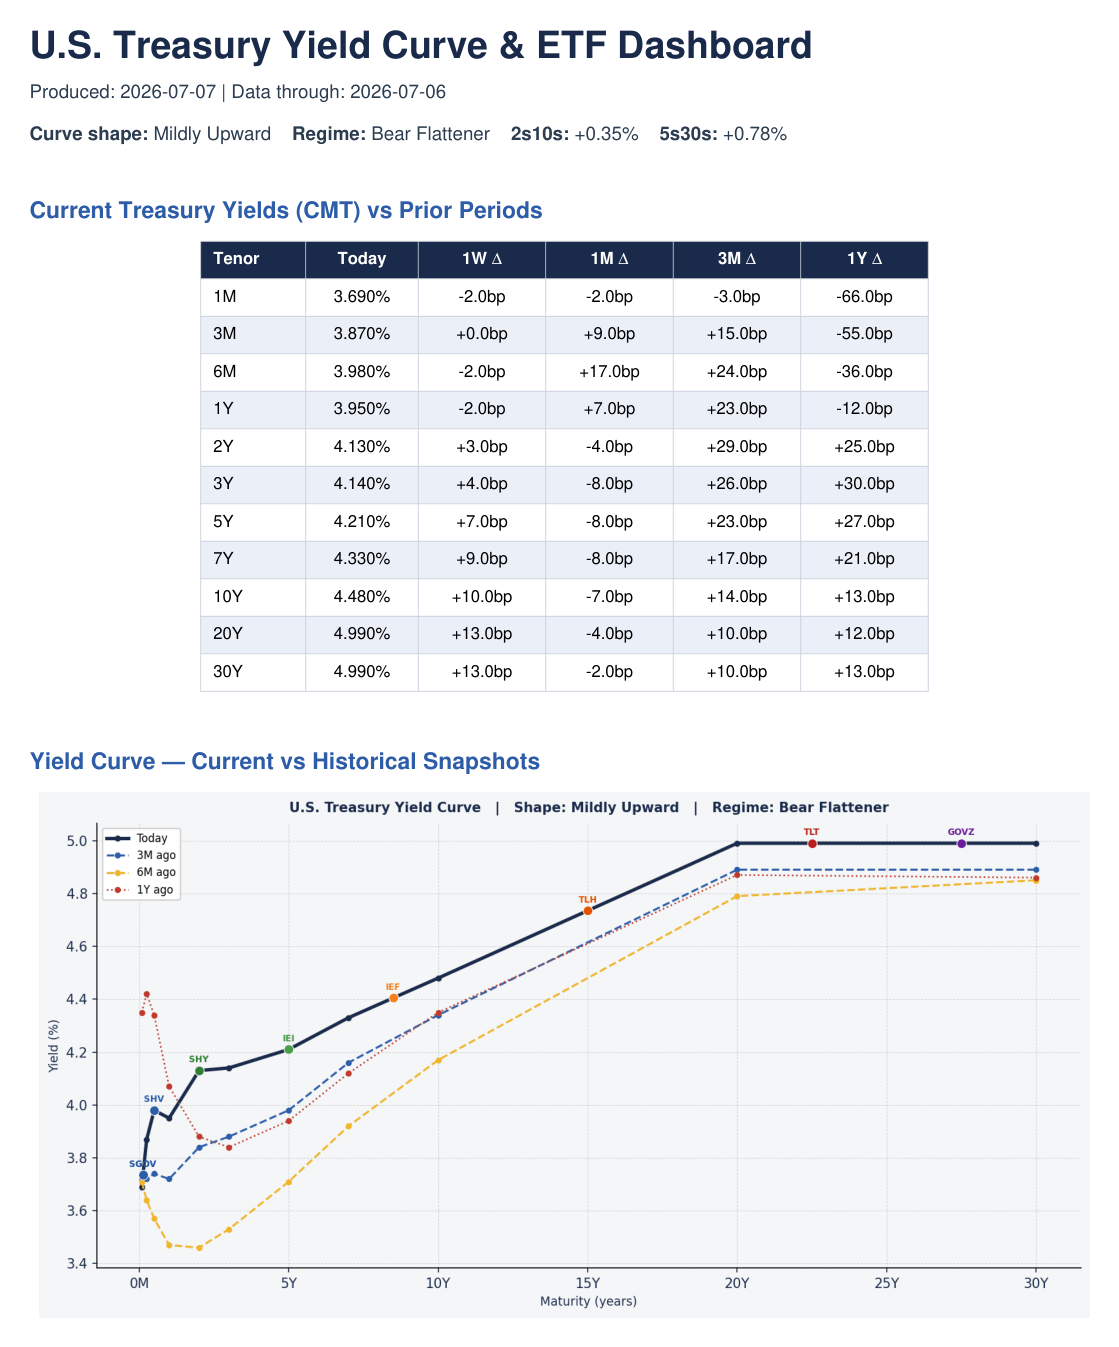
The curve is in a Bear Flattener regime. The 2s10s sits at +0.35%, the 5s30s at +0.78% — mildly upward sloping but compressing from the long end. The 10-year yield stands at 4.48%, the 30-year at 4.99%, with the 1-week change on the 10-year a notable +10bp and the 30-year +13bp. The short end is anchored — 1-month at 3.69%, 3-month at 3.87% — whilst the long end drifts higher. Long-duration positions are under persistent pressure, and GOVZ’s -1.92% daily return illustrates exactly how painful that duration exposure is right now.
ETF Sectors
SPDR Sectors
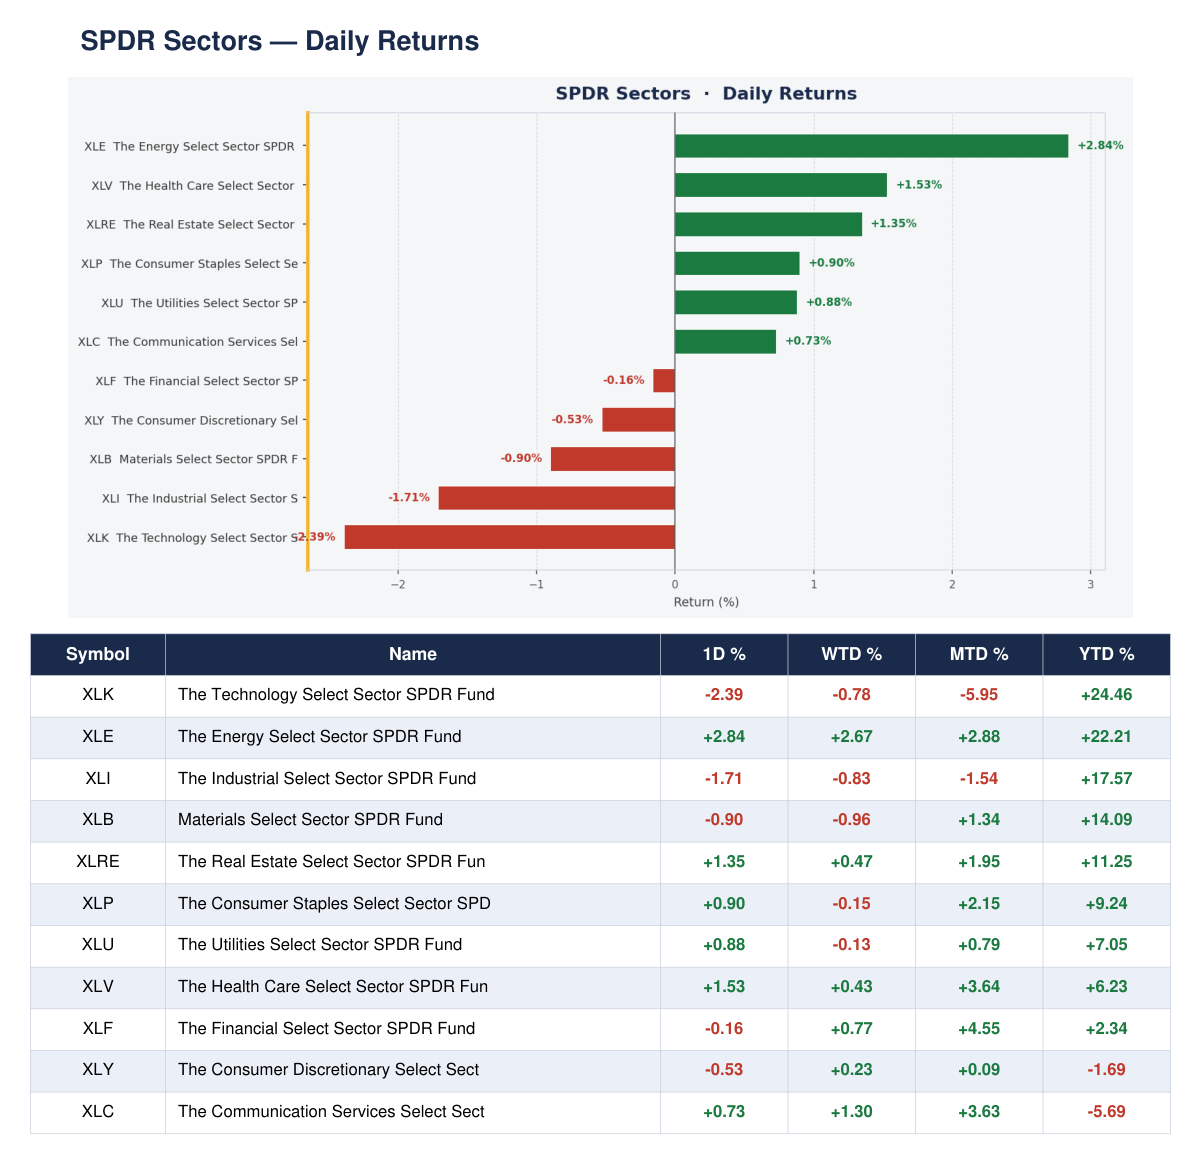
Energy (XLE) led the charge, +2.84% on the day — the standout winner by a considerable margin. Real Estate (XLRE) gained +1.35%, Healthcare (XLV) +1.53%, Consumer Staples (XLP) +0.90%, and Utilities (XLU) +0.88%. That is a classic defensive and yield-sensitive rotation. On the other side, Technology (XLK) was the worst sector at -2.39%, Industrials (XLI) fell -1.71%, Materials (XLB) -0.90%. The rotation away from growth and into defensive income sectors is a clean read on today’s sentiment.
Tech Thematic
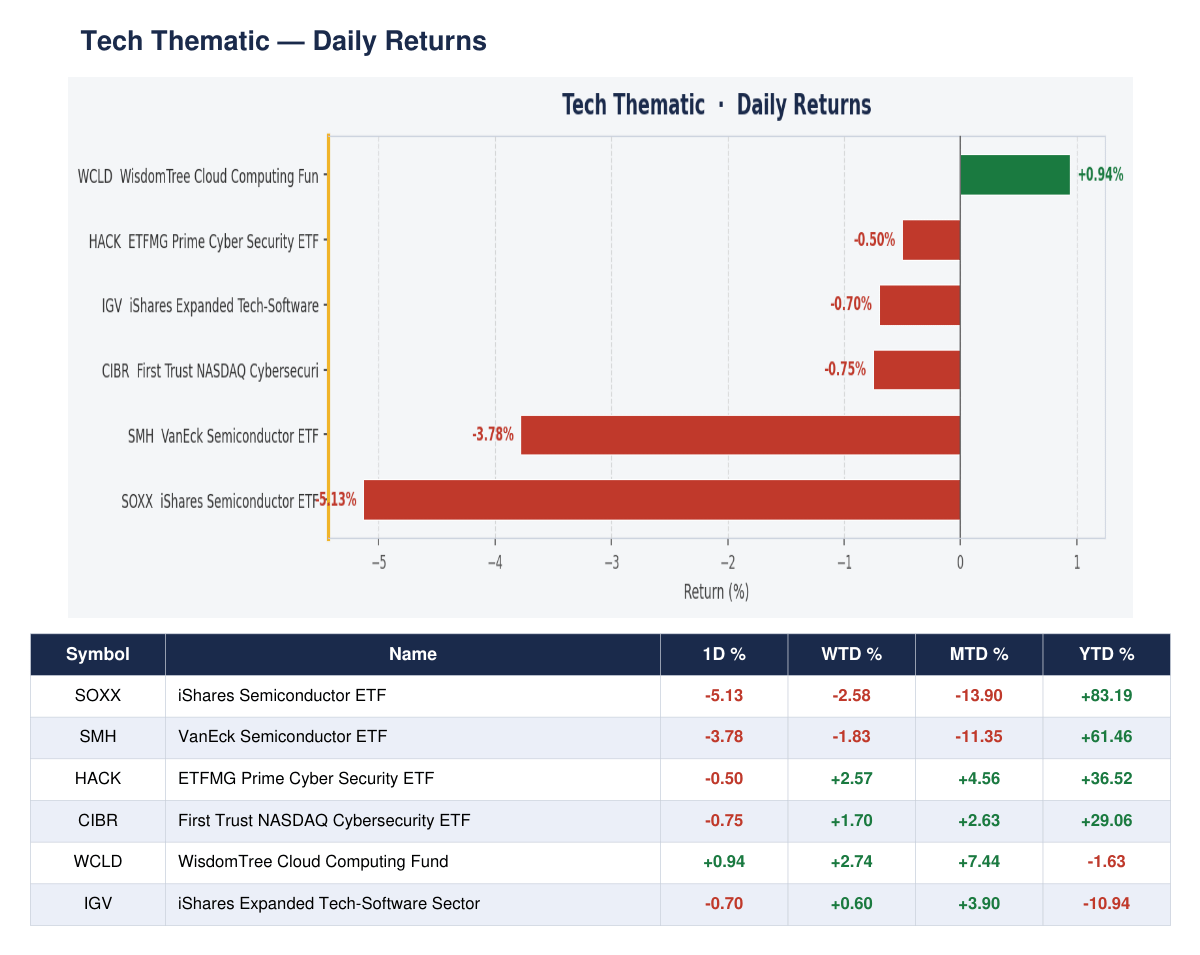
Semiconductors dominated the downside. SOXX fell -5.13%, SMH -3.78% — these are not rounding errors, this is meaningful damage. Software via IGV shed -0.70%, cybersecurity names CIBR -0.75% and HACK -0.50% held up relatively better. The one bright spot in the entire tech thematic universe was WCLD (cloud computing) at +0.94% — a modest but notable divergence. The semiconductor complex ran into heavy resistance today, adding to an MTD loss of -13.90% for SOXX. That is a line in the sand worth marking.
ARK Innovation
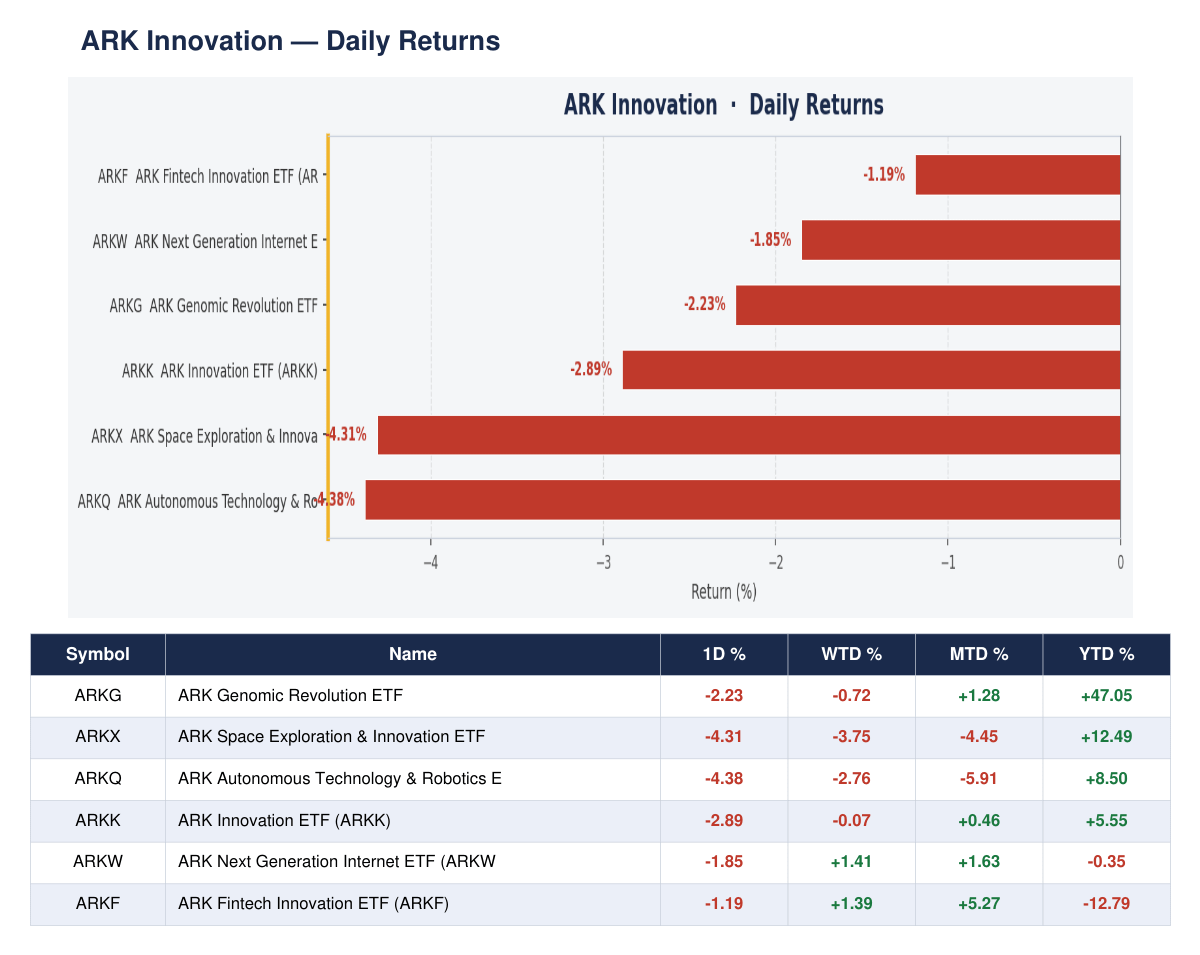
All six ARK funds declined on Tuesday. ARKQ (Autonomous Technology) led losses at -4.38%, ARKX (Space) fell -4.31%, ARKK -2.89%, ARKG -2.23%, ARKW -1.85%, and ARKF -1.19%. The relative best on the day was ARKF at -1.19%, though calling it a winner is generous. ARKG continues to hold the strongest YTD position at +47.05%. The ARK complex trades as a risk barometer and today it confirmed the broader risk-off tone without exception across all six funds.
Healthcare & Defence
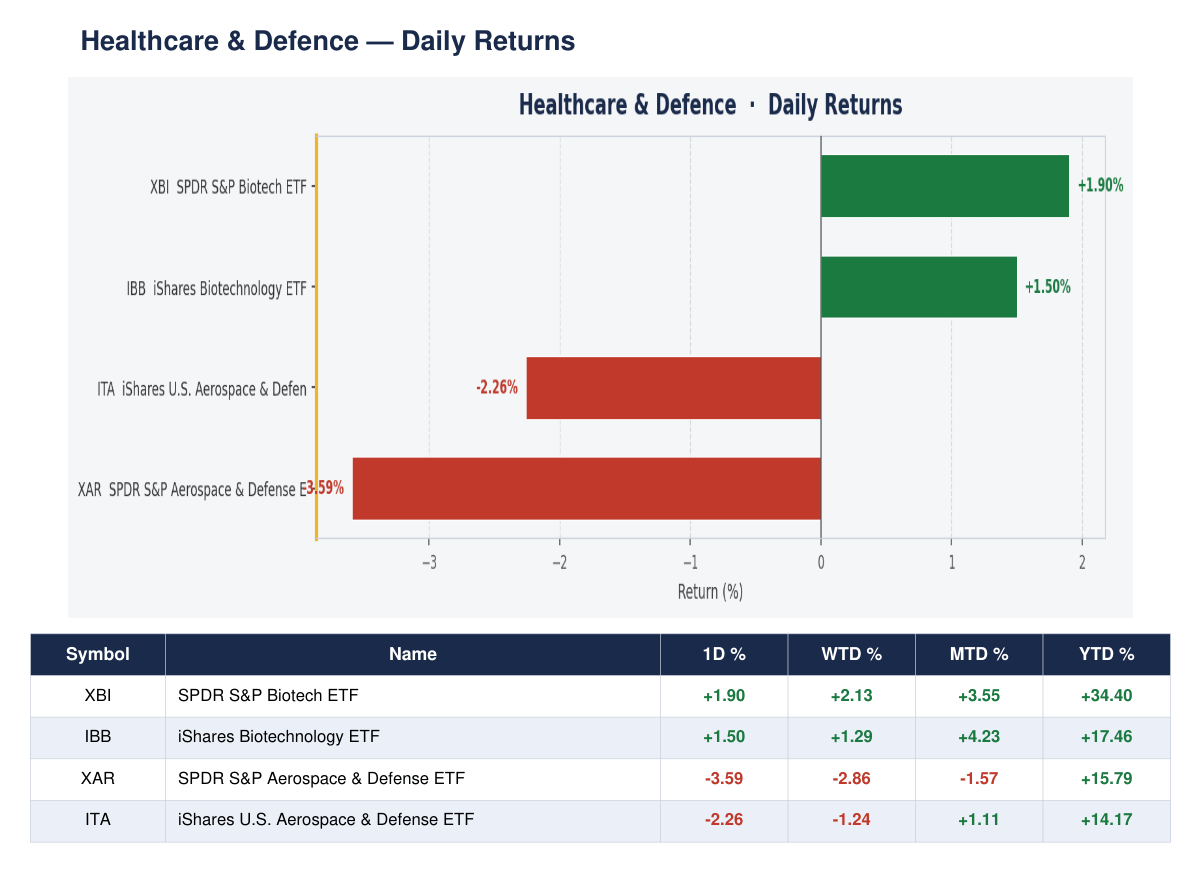
A clear intra-sector split today. Biotech led the way — XBI gained +1.90%, IBB added +1.50%. Healthcare was one of the few growth-adjacent areas attracting buyers. Defence was the opposite: XAR fell -3.59%, ITA -2.26%. Aerospace and defence names gave back ground sharply, perhaps consolidating after recent strength — XAR still sits at +15.79% YTD. The biotech strength fits the broader defensive rotation we saw in SPDR sectors and adds conviction to the healthcare bid on the day.
Consumer, Finance & Specialty
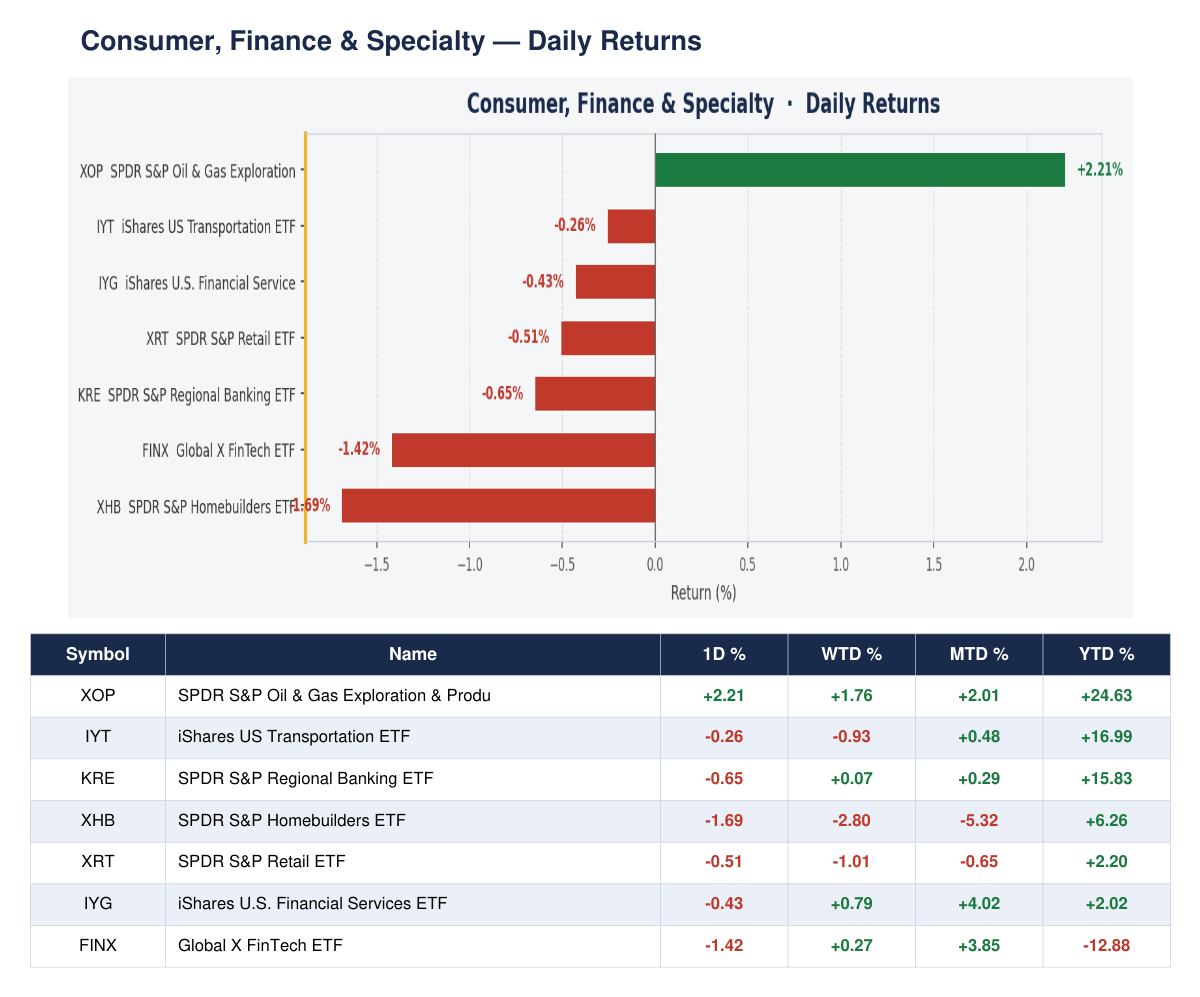
Energy-related names stood out. XOP gained +2.21%, consistent with XLE’s sector leadership. Homebuilders (XHB) were the worst in this group, down -1.69%, extending an MTD loss of -5.32%. Fintech (FINX) shed -1.42%. Regional banks (KRE) slipped -0.65%, financial services (IYG) -0.43%, retail (XRT) -0.51%. Transportation (IYT) held up relatively well at -0.26%. The consumer and fintech names traded sideways to lower, whilst energy exploration names found support and pushed higher with conviction.
Stock Screener
S&P 500 Top 20
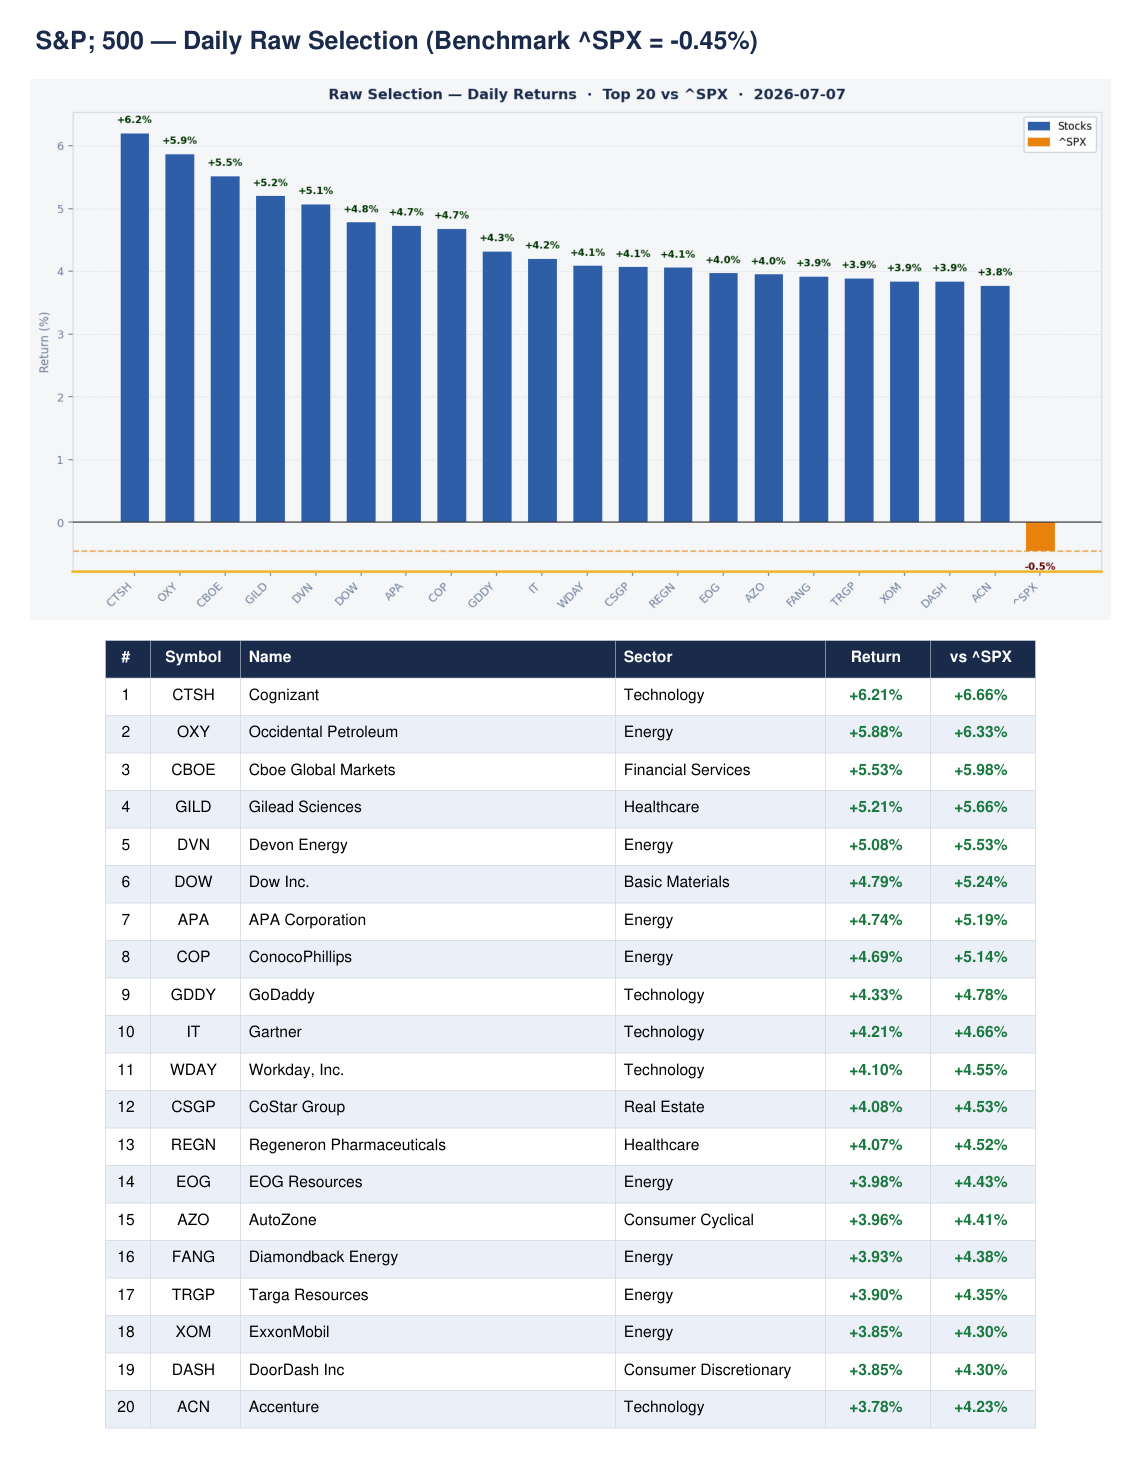
The S&P 500 fell -0.45% on Tuesday, yet our screener’s top-ranked names today were dominated by Energy and Technology. The top daily performers included CTSH (Cognizant, +6.21%), OXY (Occidental, +5.88%), CBOE (+5.53%), GILD (+5.21%), and DVN (Devon Energy, +5.08%). Energy names — OXY, DVN, APA, COP, EOG, FANG, TRGP, XOM — accounted for seven of the top 20 daily movers, consistent with XLE’s sector leadership. In our refined scored list, the top names by composite score are BNY, STT, FTNT, DDOG, NTAP, and DELL — all scoring 92/100. Financial services and technology dominate the top of our watchlist.
Russell 2000 Top 20
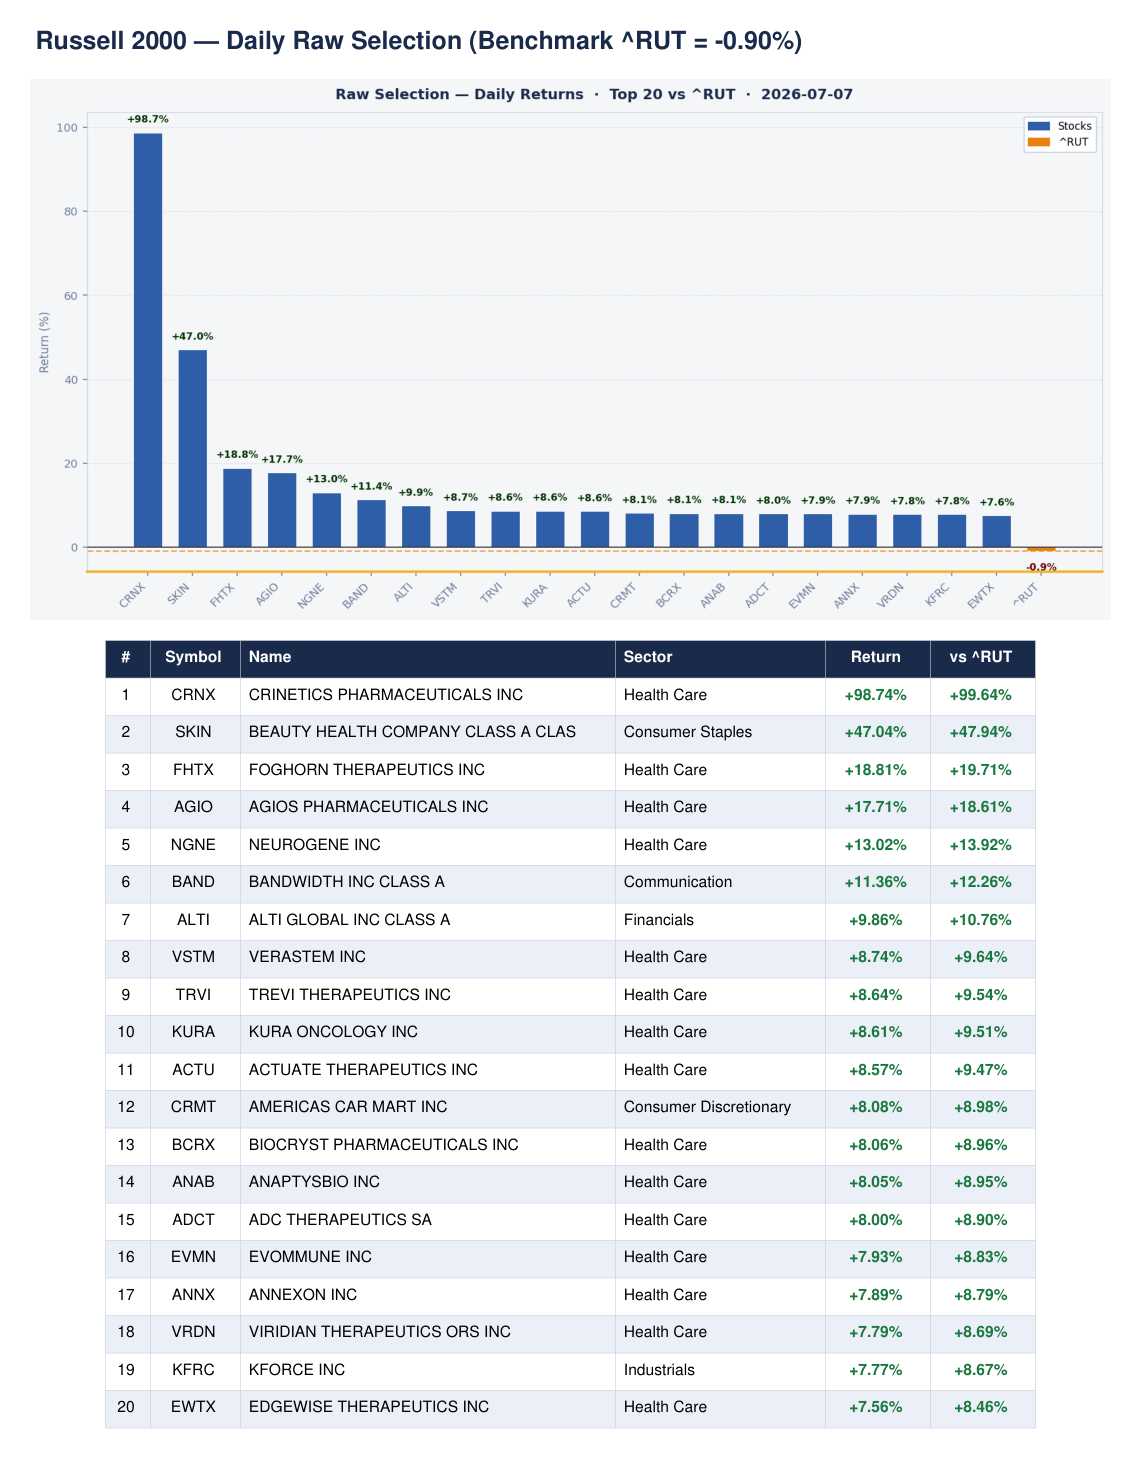
The Russell 2000 fell -0.90%, yet the top-ranked names on our screener were extraordinary movers. CRNX (Crinetics Pharmaceuticals) surged +98.74%, SKIN +47.04%, FHTX +18.81%, AGIO +17.71% — Health Care absolutely dominated the daily list with 14 of the top 20 names from that sector. In our scored and ranked list, top-ranked names include TBI, EWTX, NGNE, KFRC, and ABSI, all scoring 92/100. Health Care names continue to dominate across daily, WTD, and MTD timeframes in the Russell 2000, reflecting a sustained biotech and small-cap healthcare bid that runs counter to the broader risk-off tone in the index.
52-Week New Highs
S&P 500
The S&P 500 produced 53 new 52-week highs on Tuesday — a solid number given the index was down on the day. Financial Services led with 20 new highs, followed by Utilities (8), Real Estate (8), and Healthcare (7). Notable names hitting fresh highs include DGX (Quest Diagnostics), TTWO (Take-Two Interactive), CINF (Cincinnati Financial), ALL (Allstate), MNST (Monster Beverage), DVA (DaVita), AEP (American Electric Power), ACGL (Arch Capital), KO (Coca-Cola), and EQR (Equity Residential). The sector composition here mirrors the defensive rotation — insurers, utilities, REITs, and consumer staples all making new highs whilst tech sells off.
Russell 2000
The Russell 2000 generated 102 new 52-week highs on Tuesday — an impressive breadth reading despite the index closing down -0.90%. Health Care led with 39 new highs, Financials contributed 27, Real Estate 10, Consumer Discretionary 8, and Information Technology 5. Notable names include DAVE, CCBG, UFPT, TENB, HSTM, MAX, GCBC, STGW, BLZE, and MGTX. The breadth divergence — index down, new highs surging — reflects a bifurcated small-cap market: healthcare and financials pushing to new highs whilst tech and cyclicals drag the index lower.
FTSE 250
The FTSE 250 recorded 16 new 52-week highs on Tuesday. The breakdown spans Financial Services (3), Industrials (2), Food Producers (1), and Consumer Cyclical (1), with five names in an unclassified category. Notable names hitting new highs include BBY.L, APN.L, TCAP.L, EMG.L, BRGE.L, QLT.L, GSCT.L, MOON.L, HMSO.L, and JSG.L. Sixteen new highs on a session where the FTSE 250 fell -0.53% suggests selective demand beneath the surface — breadth holding up better than price action implies.
FTSE 100
The FTSE 100 produced just two new 52-week highs on Tuesday — CCEP.L (Coca-Cola Europacific Partners, Beverages) and SDLF.L (Life Insurance). The index gained +0.13% on the day, making it one of the few global indices in the green. Two new highs is a thin reading and reflects the FTSE 100’s defensive, commodity-heavy composition rather than genuine broad-based momentum. The index is holding up by comparison to European peers, but new high breadth remains very limited. Worth monitoring whether this picks up as the week progresses.
Markets
SPX — S&P 500
NDX — Nasdaq 100
GC1! — Gold Futures
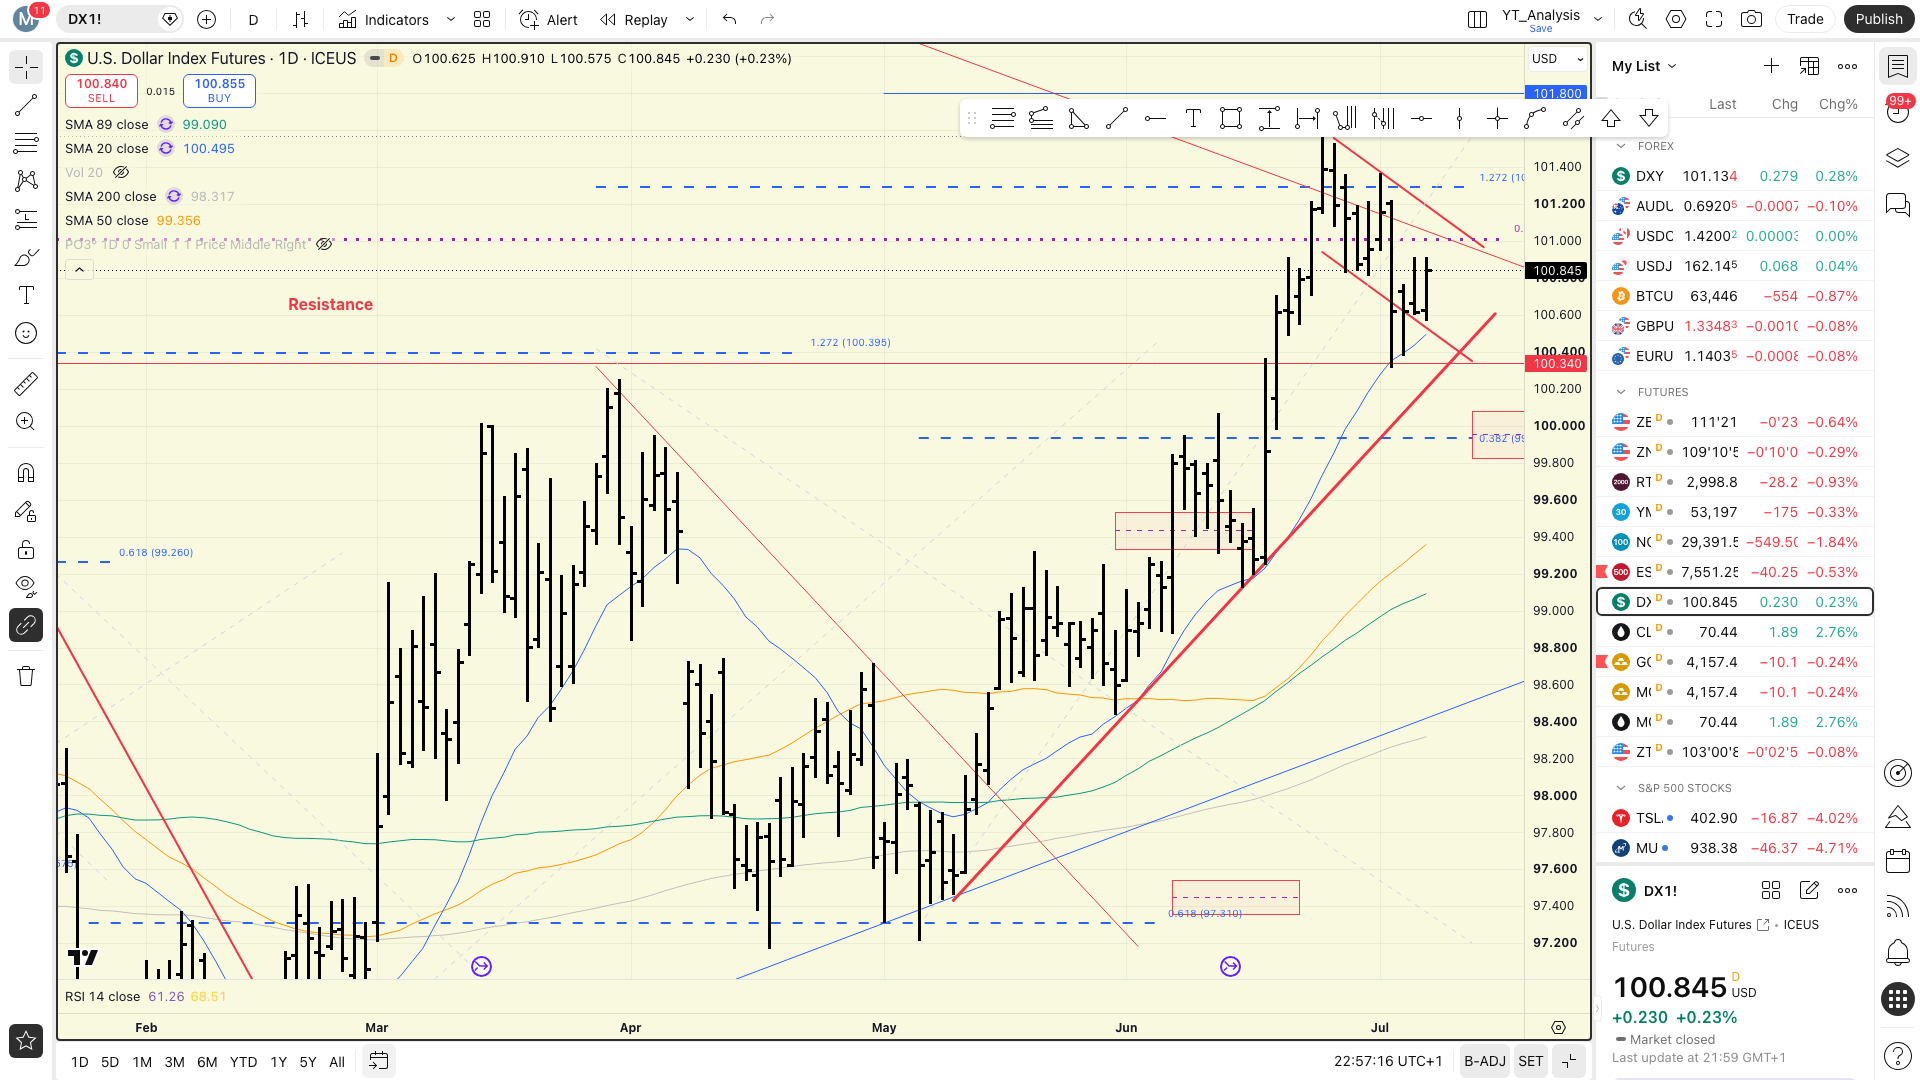
DX1! — US Dollar
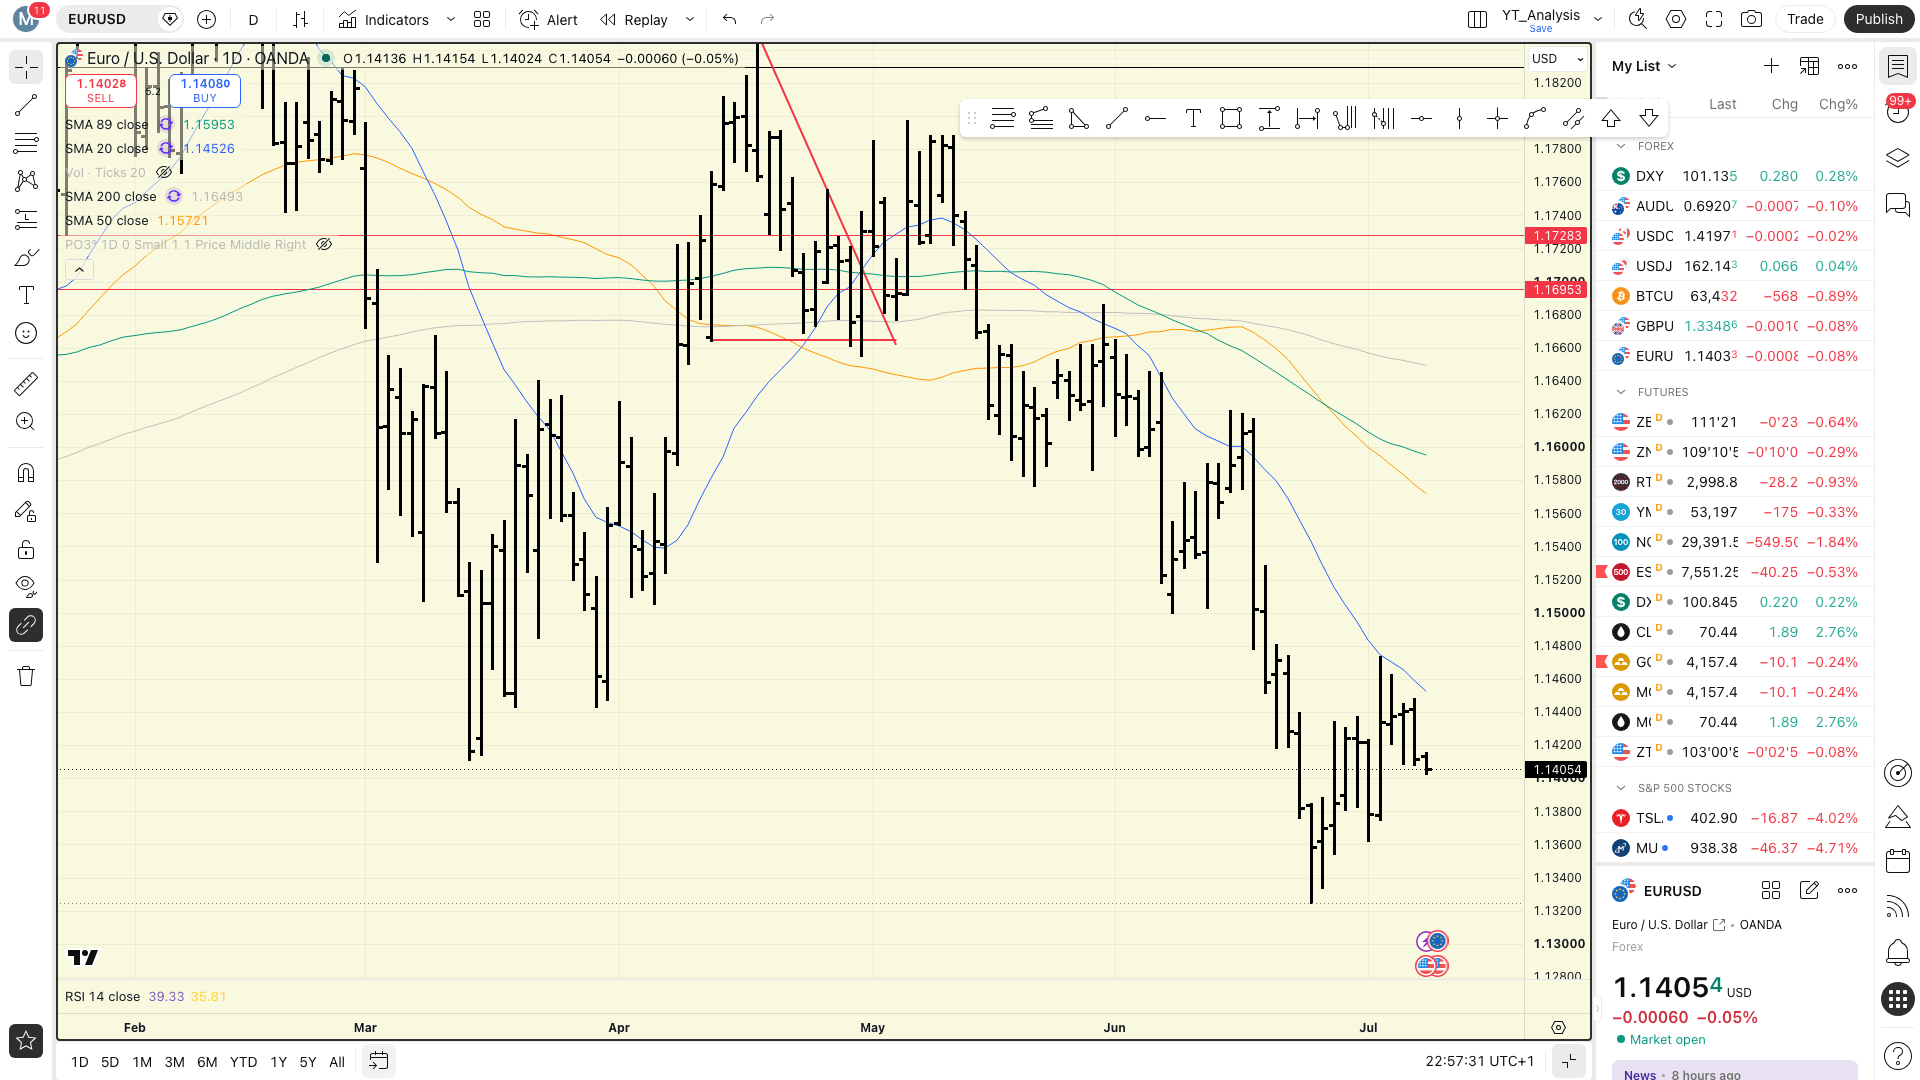
EURUSD — EUR/USD
BTCUSD — Bitcoin
Disclaimer
This publication is produced for educational and informational purposes only. Nothing in this article, including the written commentary, charts, images, data, and any internal or external links, constitute as financial advice. It is for educational purposes only.